
FIGURE
Fig 2
Fig 2
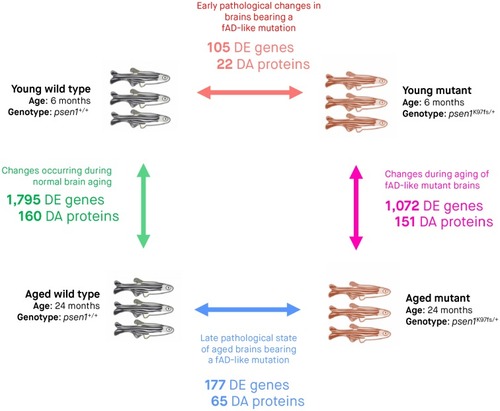
Three biological replicates (entire zebrafish brains) were subjected to RNA-seq and LC-MS/MS for each of the four experimental conditions. Arrows indicate pairwise comparisons (to identify DE genes and DA proteins) between experimental conditions. The numbers of DE genes and DA proteins determined from RNA-seq and LC-MS/MS analyses are indicated underneath the arrow for each comparison. We considered genes to be DE and proteins to be DA if the False Discovery Rate [FDR]-adjusted |
Expression Data
Expression Detail
Antibody Labeling
Phenotype Data
Phenotype Detail
Acknowledgments
This image is the copyrighted work of the attributed author or publisher, and
ZFIN has permission only to display this image to its users.
Additional permissions should be obtained from the applicable author or publisher of the image.
Full text @ PLoS One