- Title
-
Accelerated brain aging towards transcriptional inversion in a zebrafish model of the K115fs mutation of human PSEN2
- Authors
- Hin, N., Newman, M., Kaslin, J., Douek, A.M., Lumsden, A., Nik, S.H.M., Dong, Y., Zhou, X.F., Maņucat-Tan, N.B., Ludington, A., Adelson, D.L., Pederson, S., Lardelli, M.
- Source
- Full text @ PLoS One
|
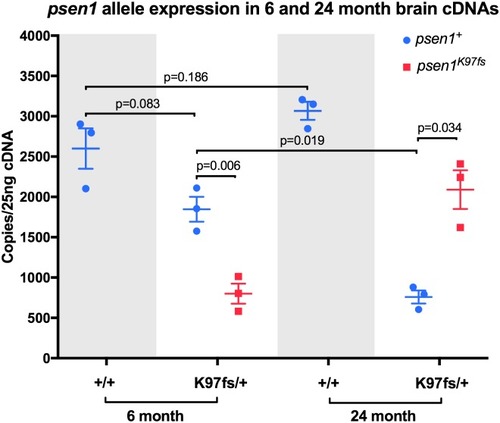
Digital quantitative PCRs specifically detecting transcripts from the heterozygous mutant (K97fs) or wild type (+) alleles of EXPRESSION / LABELING:
|
|
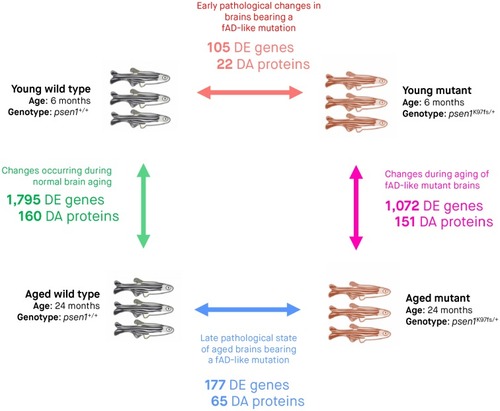
Three biological replicates (entire zebrafish brains) were subjected to RNA-seq and LC-MS/MS for each of the four experimental conditions. Arrows indicate pairwise comparisons (to identify DE genes and DA proteins) between experimental conditions. The numbers of DE genes and DA proteins determined from RNA-seq and LC-MS/MS analyses are indicated underneath the arrow for each comparison. We considered genes to be DE and proteins to be DA if the False Discovery Rate [FDR]-adjusted |
|
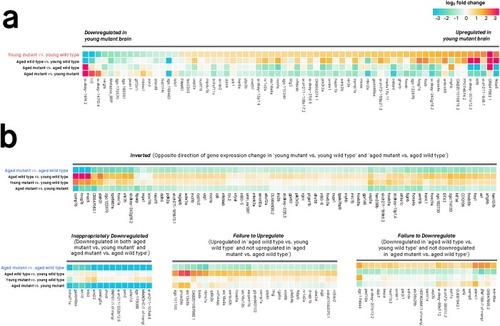
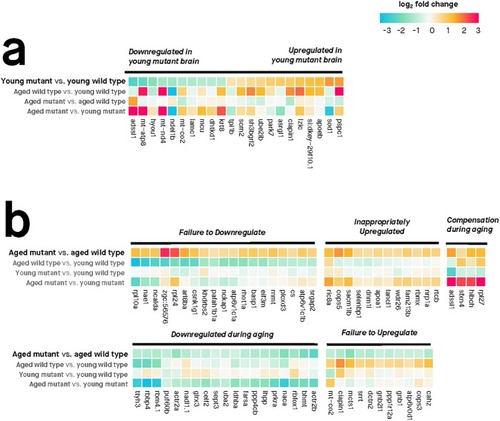
Only genes with absolute log2 fold change > 0.5 are shown. Genes were considered differentially expressed if their moderated |
|
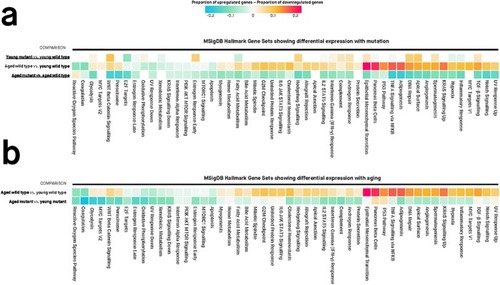
Values in each cell are the estimated proportions of up- and down-regulated genes for each gene set, for any particular pairwise comparison shown to the left of the cells. A missing cell indicates that the particular gene set is not differentially expressed for that particular pairwise comparison. Colours of cells are proportional to the difference between the proportion of up- and down-regulated genes in a gene set. Differentially expressed gene sets have Mixed FDR below 0.05, indicating genes within the gene set show statistically significantly altered (up and/or down) expression for a particular comparison. The genes in each gene set are defined using the “Hallmark” gene set collection at the Molecular Signatures Database (MSigDB). |
|
Protein abundance was quantified at the peptide-level with LC-MS/MS (liquid chromatography tandem mass spectrometry) and differential abundance was assessed using moderated |
|
|
|
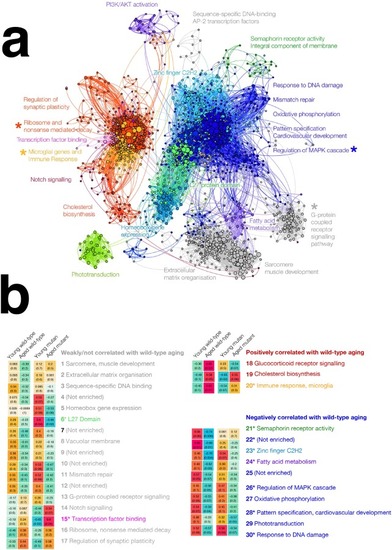
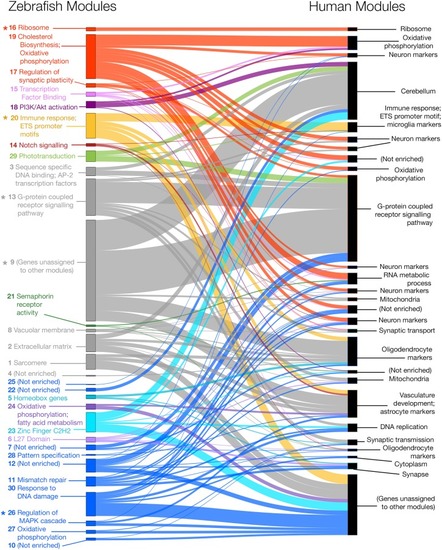
Zebrafish and human co-expression networks were constructed using 7,118 genes that were orthologs in zebrafish and humans and expressed in brain gene expression data. Modules of co-expressed genes were separately identified for both the zebrafish and human co-expression networks, resulting in 30 modules in the zebrafish network (left) and 27 modules in the human network (right). Several zebrafish modules (indicated with asterisks) were found to have |
|
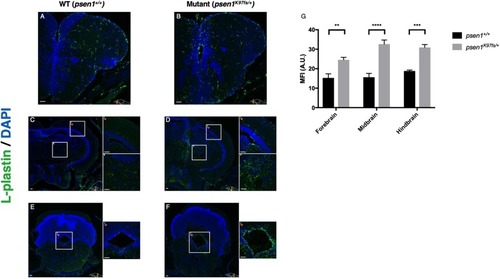
Immunostaining for the pan-leukocyte marker L-plastin supports increased numbers of microglia in the forebrain ( |
|
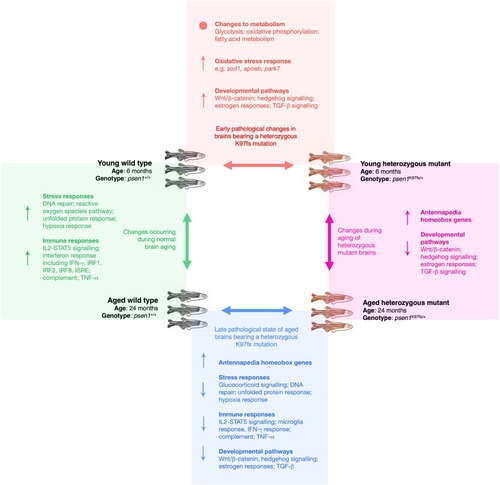
For each of the four pairwise comparisons shown, the summarised molecular changes (↑ = overall increased, ↓ = overall decreased, • = significant alterations but not in an overall direction) were inferred from a combination of the following analyses: functional enrichment analysis of differentially expressed genes and proteins, promoter motif enrichment analysis of differentially expressed genes, gene set enrichment analysis of differentially expressed genes, and weighted co-expression network analysis of the gene expression data. |

