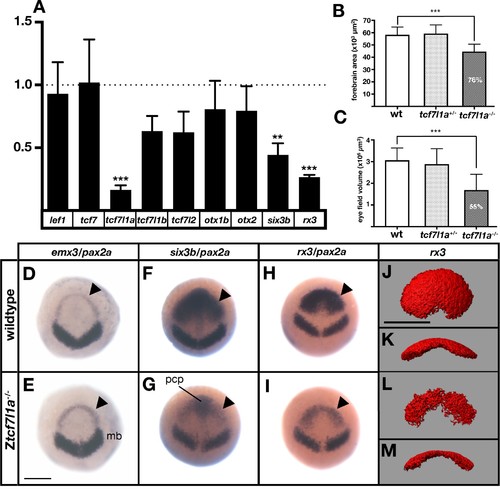
(A) Graph showing RT-qPCR quantification of the mRNA levels of lef1, tcf7, tcf7l1a, tcf7l1b, tcf7l2, otx1b, otx2, six3b and rx3 in Ztcf7l1a-/- mutants relative to wildtype embryos at 10hpf. Biological and technical triplicates, two independent experiments. (B, C) Quantification of the forebrain domain of the anterior neural plate (B) enclosed by emx3 up to pax2a (D, E) expression by in situ hybridisation (reduction to an average of 76%, n = 11, one experiment, data in Supplementary file 1B), and eye field volume (C) by rx3 fluorescent in situhybridisation confocal volume reconstruction (J–M) (reduction to an average of 55%, n = 10, one experiment, data in Supplementary file 1C). (D–I) Expression of emx3 (arrowhead)/pax2a(D, E), six3b (arrowhead)/pax2a (F, G) and rx3 (arrowhead)/pax2a (H, I) in wildtype (D, F, H) and Ztcf7l1a-/- (E, G, I) embryos detected by in situ hybridisation at 10hpf. Reduction of six3band rx3 expression 100%, n > 40, three experiments. (J–M) Confocal volume reconstruction of rx3 fluorescent in situ hybridisation in wildtype (J, K) and Ztcf7l1a-/- (L, M) mutants at 10hpf. (J, L) Dorsal view, anterior to top, and (K, M) transverse view from posterior, dorsal up. Abbreviations: mb, midbrain; pcp, prechordal plate Scale Bars = 250 µm.