
Fig. 1
- ID
- ZDB-FIG-161122-2
- Publication
- Bhattarai et al., 2016 - IL4/STAT6 Signaling Activates Neural Stem Cell Proliferation and Neurogenesis upon Amyloid-?42 Aggregation in Adult Zebrafish Brain
- Other Figures
- All Figure Page
- Back to All Figure Page
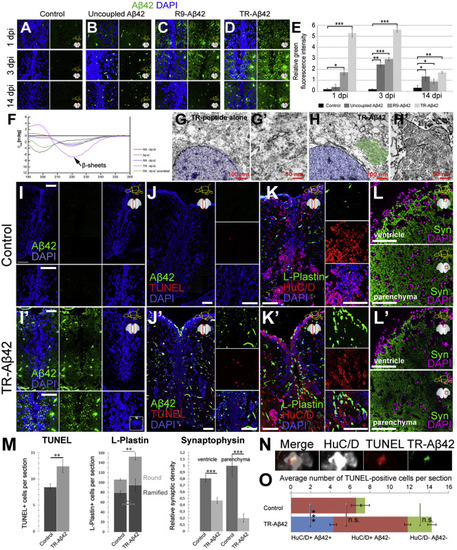
A?42 Injection Paradigm and Aggregation-Dependent Phenotypes in Adult Zebrafish Brain (A) Immunohistochemistry (IHC) for A?42 in control brains at 1, 3, and 14 days post-injection (dpi) of PBS. Right panels: green channel. (B-D) IHC for A?42 in brains injected with uncoupled A?42 (B), R9-A?42 (C), or TR-A?42 (D). (E) Quantification for green fluorescence intensity as a measure of amyloid deposition. (F) CD spectra for all A?42 versions in buffer (PBS). A?42 peptides show ? sheet formation. (G-H') Electron micrographs of TR-alone- (G) and TR-A?42-injected (H) brains. Blue, nucleus; green, amyloid. (G' and H') Higher magnification of perinuclear regions with A?42. (I and I') IHC for A?42 in control (I) and TR-A?42-injected (I?) brains. Green and DAPI are shown separately. (J and J') TUNEL for control (J) and TR-A?42-injected (J') brains. Insets: single channels of a close-up region. (K and K') HuC/D and L-Plastin in control (K) and TR-A?42-injected (K') brains. (L and L') Synaptophysin in control (L) and TR-A?42-injected (L') brains. (M) Quantification for (J-L'). (N) IHC for HuC/D and TR-A?42 coupled to TUNEL staining. (O) Categorization of TUNEL-positive cells according to HuC/D expression and presence of A?42. Scale bars, 100 ?m. Data are represented as mean � SD; n = 3 fish. ?p < 0.05; ??p < 0.01; ???p < 0.001. See also Figures S1?S3. |
| Antibodies: | |
|---|---|
| Fish: | |
| Condition: | |
| Anatomical Terms: | |
| Stage: | Adult |
| Fish: | |
|---|---|
| Condition: | |
| Observed In: | |
| Stage: | Adult |