
|
Fig. 1
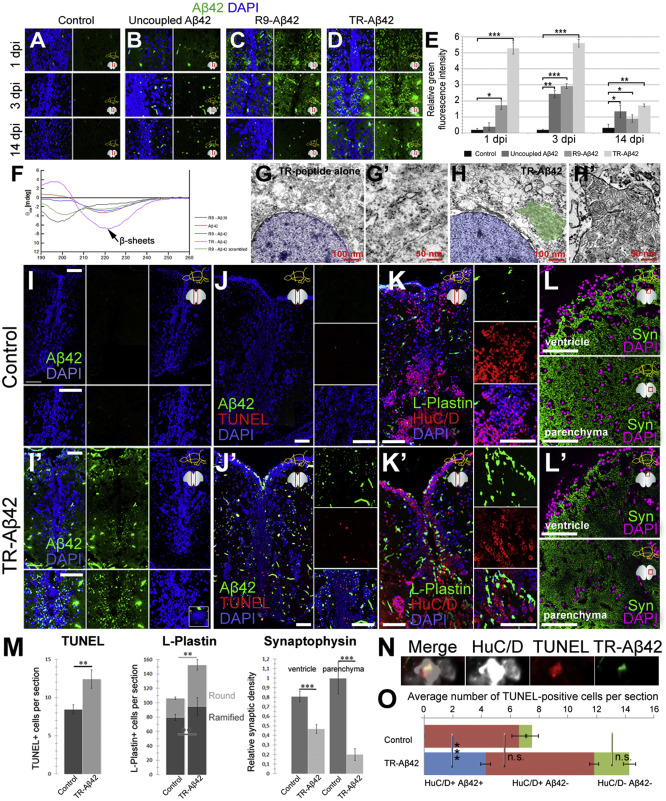
Aβ42 Injection Paradigm and Aggregation-Dependent Phenotypes in Adult Zebrafish Brain
(A) Immunohistochemistry (IHC) for Aβ42 in control brains at 1, 3, and 14 days post-injection (dpi) of PBS. Right panels: green channel.
(B-D) IHC for Aβ42 in brains injected with uncoupled Aβ42 (B), R9-Aβ42 (C), or TR-Aβ42 (D).
(E) Quantification for green fluorescence intensity as a measure of amyloid deposition.
(F) CD spectra for all Aβ42 versions in buffer (PBS). Aβ42 peptides show β sheet formation.
(G-H') Electron micrographs of TR-alone- (G) and TR-Aβ42-injected (H) brains. Blue, nucleus; green, amyloid. (G' and H') Higher magnification of perinuclear regions with Aβ42.
(I and I') IHC for Aβ42 in control (I) and TR-Aβ42-injected (I’) brains. Green and DAPI are shown separately.
(J and J') TUNEL for control (J) and TR-Aβ42-injected (J') brains. Insets: single channels of a close-up region.
(K and K') HuC/D and L-Plastin in control (K) and TR-Aβ42-injected (K') brains.
(L and L') Synaptophysin in control (L) and TR-Aβ42-injected (L') brains.
(M) Quantification for (J-L').
(N) IHC for HuC/D and TR-Aβ42 coupled to TUNEL staining.
(O) Categorization of TUNEL-positive cells according to HuC/D expression and presence of Aβ42.
Scale bars, 100 μm. Data are represented as mean ± SD; n = 3 fish. ∗p < 0.05; ∗∗p < 0.01; ∗∗∗p < 0.001. See also Figures S1–S3.