Fig. 4
- ID
- ZDB-FIG-161122-6
- Publication
- Bhattarai et al., 2016 - IL4/STAT6 Signaling Activates Neural Stem Cell Proliferation and Neurogenesis upon Amyloid-?42 Aggregation in Adult Zebrafish Brain
- Other Figures
- All Figure Page
- Back to All Figure Page
|
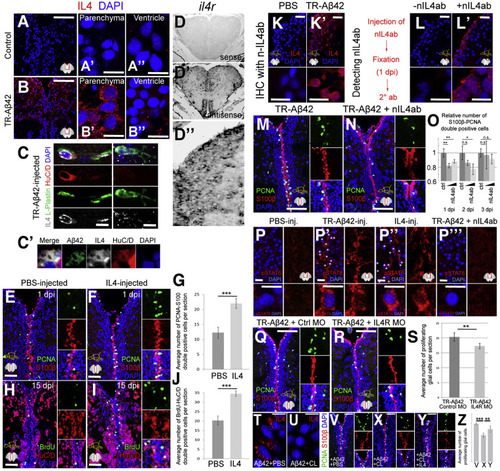
Interleukin-4 Is Necessary and Sufficient for A?42-Dependent Stem Cell Proliferation and Neurogenesis in Adult Zebrafish Brain (A?B'') IL4 in control (A?A'') and TR-A?42-injected (B-B'') brains. Parenchyma (A' and B') and ventricle (A'' and B'') are shown. (C) IL4, L-plastin, and HuC/D in TR-A?42-injected brains. (C') Close-up on a neuron (HuC/D-positive, red) with TR-A?42 (green) and IL4 (white). (D?D'') il4r receptor expression in TR-A?42 brains at 3 dpi. Sense (D) and antisense (D'). (D'') High magnification. (E and F) S100? and PCNA in control (E) and IL4-injected (F) brains. (G) Quantification graph for (E and F). (H and I) BrdU and HuC/D in control (H) and IL4-injected (I) brains. (J) Quantification graph for (H and I). (K and K') IL4 detection with neutralizing antibody in control (K) and TR-A?42-injected (K') brains. (L and L') Secondary antibody staining for the neutralizing IL4 antibody (nIL4ab) in uninjected (L) and injected brains at 1 day after injection (L'). (M and N) PCNA and S100? in TR-A?42-injected (M) and in TR-A?42 + neutralizing antibody-co-injected (N) brains. Insets: single fluorescence channels. (O) Quantification graph. Control = 1. (P?P''') Phospho-STAT6 in PBS- (P), TR-A?42- (P'), IL4- (P?), and TR-A?42 + neutralizing IL4-antibody-injected (P''') brains. Red channels shown separately. Insets: close-up image of one exemplary cell. (Q?S) PCNA and S100 in TR-A?42 and control morpholino-injected (Q) and in TR-A?42 and IL4R morpholino-injected (R) brains. (S) Quantification graph. (T and U) IL4 after TR-A?42 in PBS (T) or clodronate-injected (U) brains. (V?Z) PCNA and S100 after TR-A?42 in PBS (V), clodronate (X) or clodronate + IL4-injected (Y) brains. (Z) Quantification graph for (V?Y). Scale bars, 50 ?m (A, B, E?I, M, N, Q, R,V?Y), 10 ?m (A', A'', B', B'', C, P?P''', T, and U), and 20 ?m (K?L'). Data are represented as mean ± SD; n = 4 fish. ?p < 0.05; ??p < 0.01; ???p < 0.001; n.s., not significant. See also Figure S4. |
| Gene: | |
|---|---|
| Antibodies: | |
| Fish: | |
| Condition: | |
| Knockdown Reagent: | |
| Anatomical Terms: | |
| Stage: | Adult |
| Fish: | |
|---|---|
| Condition: | |
| Knockdown Reagent: | |
| Observed In: | |
| Stage: | Adult |

