
Fig. 3
- ID
- ZDB-FIG-111031-4
- Publication
- Kroehne et al., 2011 - Regeneration of the adult zebrafish brain from neurogenic radial glia-type progenitors
- Other Figures
- All Figure Page
- Back to All Figure Page
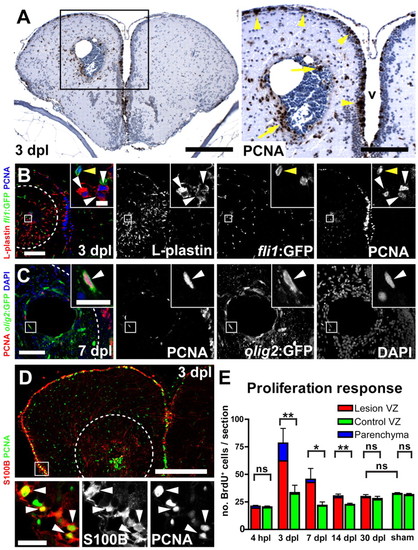
Reactive proliferation. (A) Many mitotic, PCNA+ (brown) cells are detected close to the lesion (3 dpl) in the parenchyma (arrows), as well as in the VZ (arrowheads). In the contralateral hemisphere, fewer PCNA+ cells are detected in the VZ and only very few in the parenchyma (v, ventricle). Nuclei are counterstained with Nissl (blue). (B) Using a pan-leukocyte marker (L-plastin, red) combined with PCNA (blue) identifies leukocytes as the major proliferating cell population in the parenchyma (white arrowheads). PCNA+ endothelial cells are also found in the parenchyma (yellow arrowhead), as shown by analysis for fli1:GFP expression (green). (C) Olig2:GFP+ (green) oligodendrocyte-precursor cells are ectopically proliferating (PCNA, red, arrowhead) in the parenchyma. (D) S100B+ (red) radial glia increase proliferation (PCNA, green, arrowheads) within the VZ in lesioned hemispheres. Broken outlines represent the lesion canal. Scale bars: 200 μm in A, inset 100 μm; 100 μm in B, inset 10 μm; 50 μm in C, inset 10 μm; 200 μm in D, inset 20 μm. (E) Quantification of the number of BrdU+ cells (2 hours BrdU pulse) shows a significant upregulation of the total number of proliferating cells in the lesioned (red bars) versus the control hemisphere (green bars) at 3, 7 and 14 dpl (n=5, n=4 and n=5, respectively). At 4 hpl and at 30 dpl, no significant difference is detected between lesioned, contralateral and sham-operated hemispheres (n=3, n=4 and n=3, respectively). At 3 dpl, reactive proliferation reaches its peak, and the majority of mitotic cells are located within the VZ (79.5%�14.8%, red). Data are mean+s.e.m. **Pd0.01; *Pd0.05. |