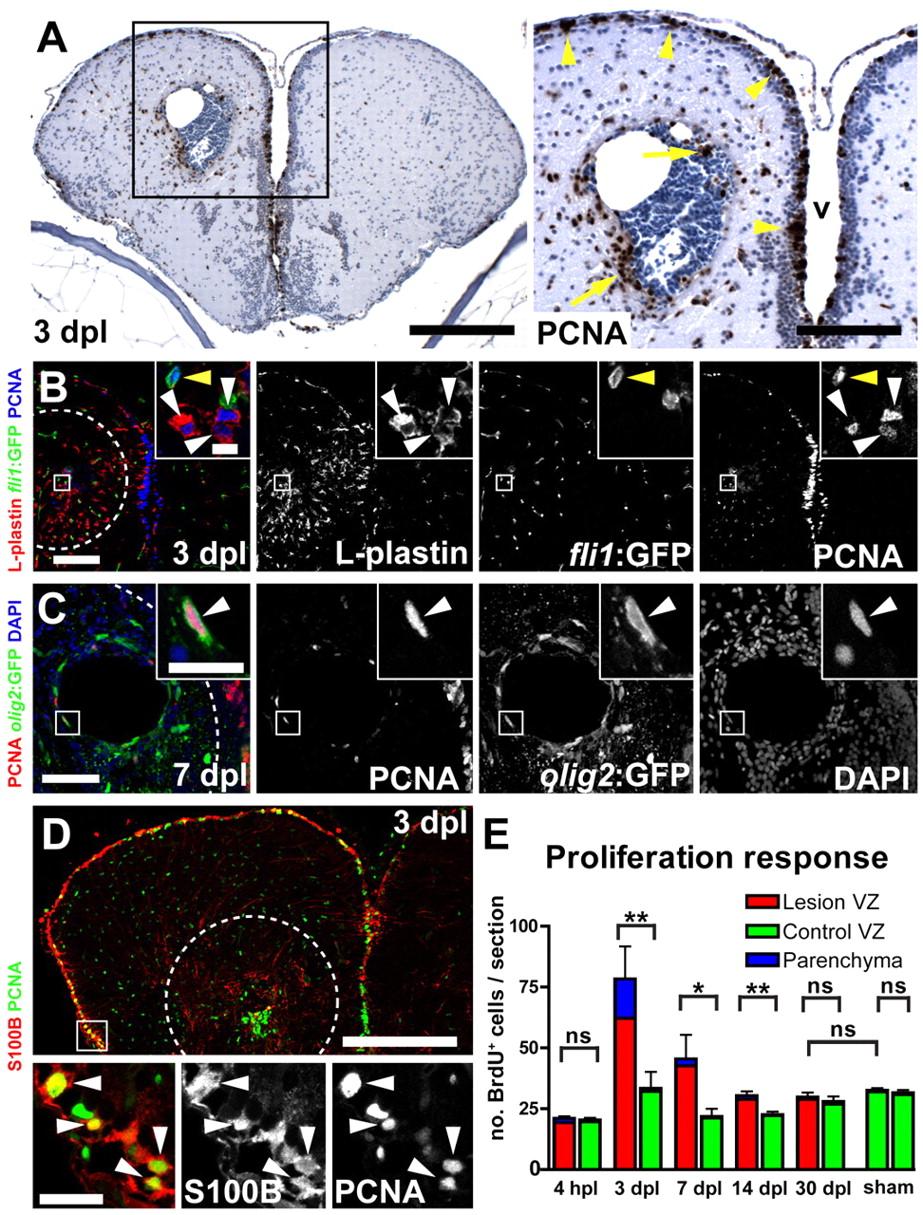
Fig. 3 Reactive proliferation. (A) Many mitotic, PCNA+ (brown) cells are detected close to the lesion (3 dpl) in the parenchyma (arrows), as well as in the VZ (arrowheads). In the contralateral hemisphere, fewer PCNA+ cells are detected in the VZ and only very few in the parenchyma (v, ventricle). Nuclei are counterstained with Nissl (blue). (B) Using a pan-leukocyte marker (L-plastin, red) combined with PCNA (blue) identifies leukocytes as the major proliferating cell population in the parenchyma (white arrowheads). PCNA+ endothelial cells are also found in the parenchyma (yellow arrowhead), as shown by analysis for fli1:GFP expression (green). (C) Olig2:GFP+ (green) oligodendrocyte-precursor cells are ectopically proliferating (PCNA, red, arrowhead) in the parenchyma. (D) S100B+ (red) radial glia increase proliferation (PCNA, green, arrowheads) within the VZ in lesioned hemispheres. Broken outlines represent the lesion canal. Scale bars: 200 μm in A, inset 100 μm; 100 μm in B, inset 10 μm; 50 μm in C, inset 10 μm; 200 μm in D, inset 20 μm. (E) Quantification of the number of BrdU+ cells (2 hours BrdU pulse) shows a significant upregulation of the total number of proliferating cells in the lesioned (red bars) versus the control hemisphere (green bars) at 3, 7 and 14 dpl (n=5, n=4 and n=5, respectively). At 4 hpl and at 30 dpl, no significant difference is detected between lesioned, contralateral and sham-operated hemispheres (n=3, n=4 and n=3, respectively). At 3 dpl, reactive proliferation reaches its peak, and the majority of mitotic cells are located within the VZ (79.5%±14.8%, red). Data are mean+s.e.m. **Pd0.01; *Pd0.05.
Image
Figure Caption
Acknowledgments
This image is the copyrighted work of the attributed author or publisher, and
ZFIN has permission only to display this image to its users.
Additional permissions should be obtained from the applicable author or publisher of the image.
Full text @ Development

