
- Title
-
fhl2b mediates extraocular muscle protection in zebrafish models of muscular dystrophies and its ectopic expression ameliorates affected body muscles
- Authors
- Dennhag, N., Kahsay, A., Nissen, I., Nord, H., Chermenina, M., Liu, J., Arner, A., Liu, J.X., Backman, L.J., Remeseiro, S., von Hofsten, J., Pedrosa Domellöf, F.
- Source
- Full text @ Nat. Commun.
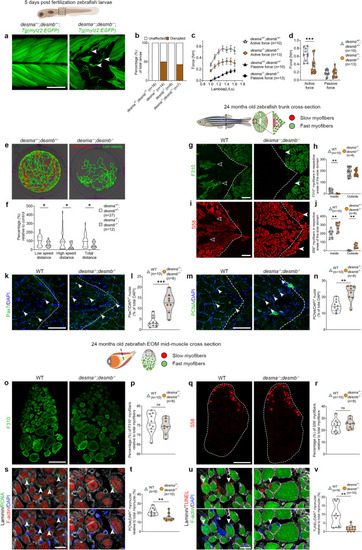
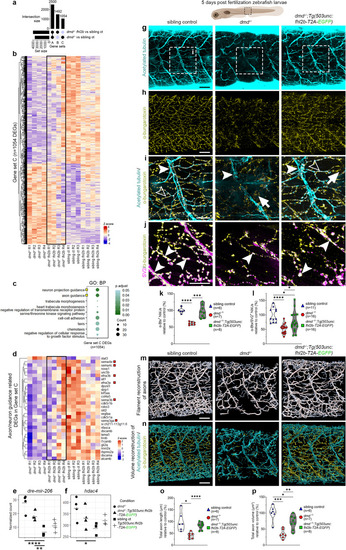
Lack of desmin causes myofiber impairment and a metabolic shift in trunk myofibers. PHENOTYPE:
|
|
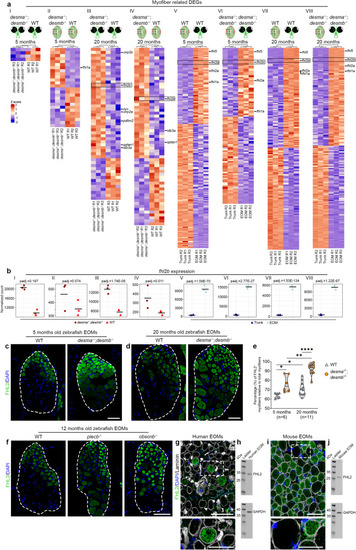
Lack of Fhl2 causes EOM myofiber hypertrophy. Cross-sections of 12 months old WT, |
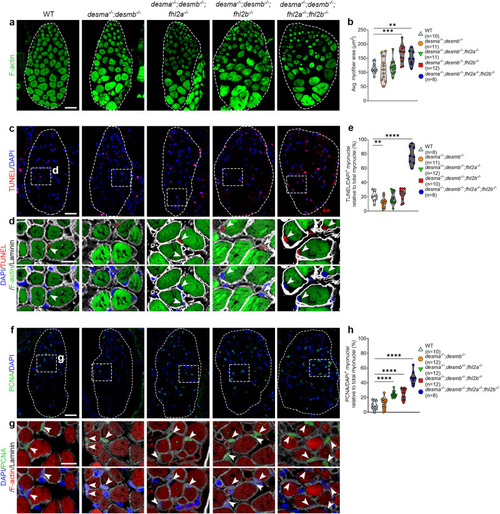
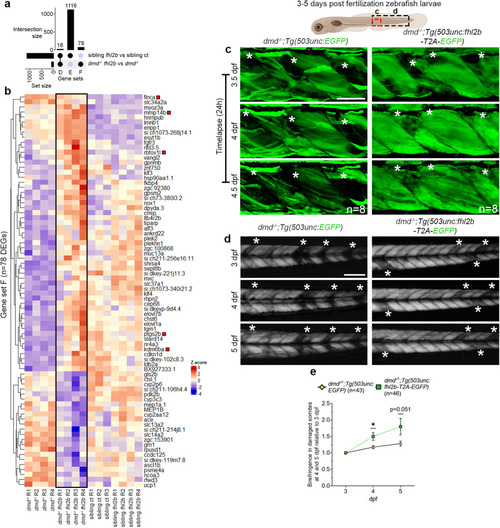
Muscle specific overexpression of PHENOTYPE:
|
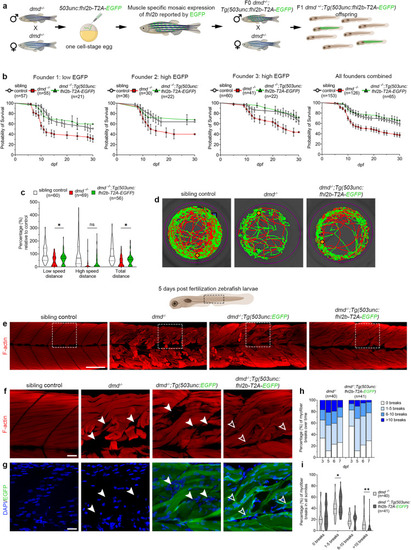
Muscle specific overexpression of |
EXPRESSION / LABELING:
PHENOTYPE:
|
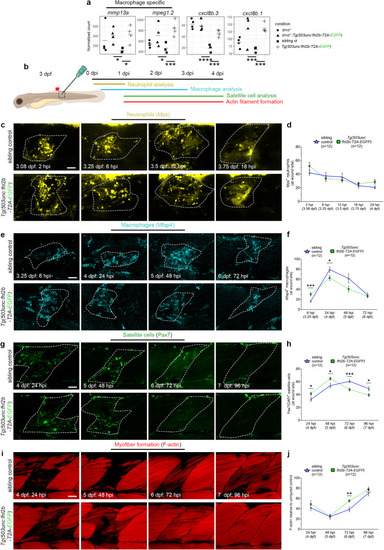
Muscle wound healing is enhanced in EXPRESSION / LABELING:
PHENOTYPE:
|
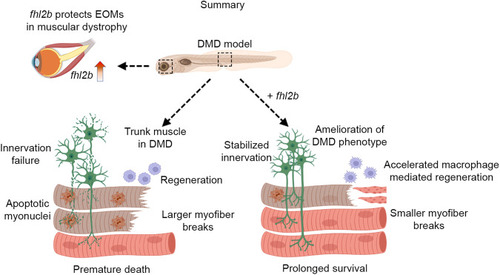
Model for |