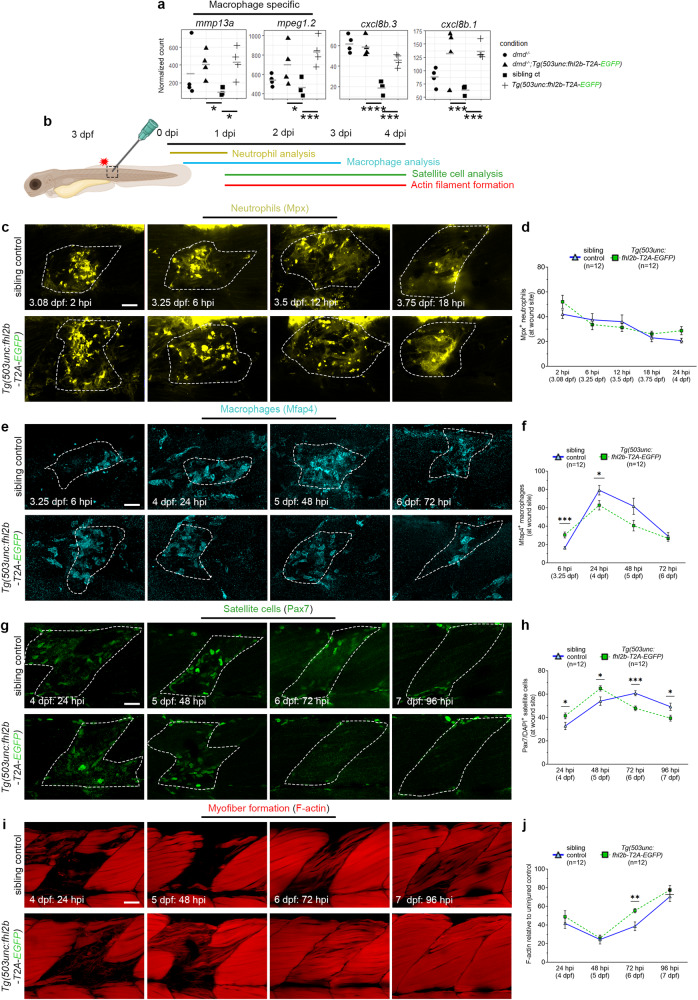
IMAGE

Fig. 7

ID
ZDB-IMAGE-240306-65
Genes
Antibodies
Source
Figures for Dennhag et al., 2024
Image
Figure Caption

Fig. 7 Muscle wound healing is enhanced in fhl2b overexpressing larvae.

a Normalized counts for mmp13a (p.adj=0.012, p.adj=0.023), mpeg1.2 (p.adj=0.015, p.adj=0.0009), cxcl8b.3 (p.adj=7.4e−8, p.adj=0.0007) and cxcl8b.1 (p.adj=0.0005, p.adj=0.0001). Comparisons were made between dmd−/−:Tg(503unc: fhl2b-T2A-EGFP) vs sibling controls (dmd+/+, dmd+/-) and Tg(503unc: fhl2b-T2A-EGFP) vs sibling controls, respectively. b Wound healing assay experimental setup indicating area of needle-stick injury and timepoints for the different analyzes presented below. c Lateral view of injured somites in sibling controls and Tg(503unc:fhl2b-T2A-EGFP) zebrafish embryos immunolabeled with neutrophil specific Mpx antibody between 2–18 hpi. Dashed lines indicate wounded areas. Quantifications of Mpx+ neutrophils at wound size is presented in d. e Lateral view of injured somites in sibling controls and Tg(503unc:fhl2b-T2A-EGFP) zebrafish embryos immunolabeled with macrophage specific antibody Mfap4 between 6–72 hpi. Dashed lines indicate wounded areas. f Quantification of Mfap4+/DAPI+ cells in sibling controls and Tg(503unc:fhl2b-T2A-EGFP) at 6 (p = 0.0019), 24 (p = 0.0374), 48 and 72 hpi. g Lateral view of injured somites in sibling controls and Tg(503unc:fhl2b-T2A-EGFP) zebrafish embryos immunolabeled with satellite cell specific Pax7antibody at 24–96 hpi. h Quantification of Pax7+/DAPI+ cells in sibling controls and Tg(503unc:fhl2b-T2A-EGFP) at 24 (p = 0.0445), 48 (p = 0.0198), 72 (p = 0.0002) and 96 hpi (p = 0.0246). i Lateral view of injured somites in sibling controls and Tg(503unc:fhl2b-T2A-EGFP) zebrafish embryos labeled with phalloidin (F-actin) at 24–96 hpi. j Quantification of F-actin intensity at wound site in sibling controls and Tg(503unc:fhl2b-T2A-EGFP) at 24, 48, 72 (p = 0.0045) and 96 hpi. Statistical analysis in a: Two-sided Wald test with B/H-correction, d, f, h, j: Two-sided t-tests with Welch correction. Data in graphs is presented as mean ± SEM. Scale bar: 25 µm. Schematic images were adapted from https://www.biorender.com.

Figure Data
Acknowledgments
This image is the copyrighted work of the attributed author or publisher, and ZFIN has permission only to display this image to its users. Additional permissions should be obtained from the applicable author or publisher of the image. Full text @ Nat. Commun.