|
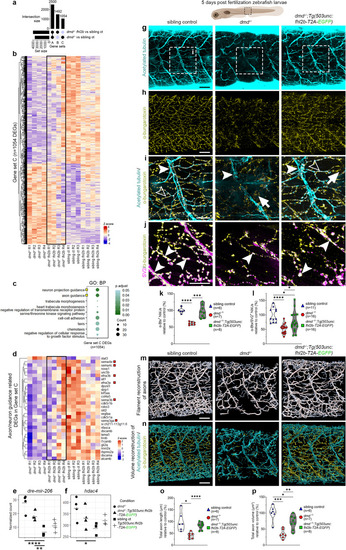
Muscle specific overexpression of fhl2b ameliorates axon and neuromuscular junction integrity in dmd−/− zebrafish larvae. a Upset plot showing intersection of DEGs between dmd−/−:Tg(503unc:fhl2b-T2A-EGFP) vs sibling controls (dmd+/+, dmd+/-) and dmd−/− vs sibling controls (Gene set A: disease-related DEGs shared between dmd−/− and dmd−/−;Tg(503unc:fhl2b-T2A-EGFP); Gene set B: DEGs unique to dmd−/−;Tg(503unc: fhl2b-T2A-EGFP) larvae; Gene set C: disease-related DEGs specific to dmd−/− larvae). b Heatmap displaying the expression of 1054 DEGs in Gene set C. c GO terms enriched in genes from gene set C. Yellow boxes: GO terms related to axon and neuron projection guidance; BP: Biological Process. d Heatmap displaying the expression of axon and neuron guidance related DEGs, red boxes: semaphorin and ephrin DEGs. Normalized counts for edre-mir-206 (p.adj=0.00005, p.adj=0.009) and fhdac4 (p.adj=0.02). Comparisons were made between dmd−/− vs sibling controls and dmd−/−:Tg(503unc:fhl2b-T2A-EGFP) vs sibling controls, respectively. g Sibling control, dmd−/− and dmd−/−;Tg(503unc:fhl2b-T2A-EGFP) larvae immunolabeled for acetylated tubulin and h α-bungarotoxin. i Magnification of dashed boxes in g), arrowheads: axons, open arrowheads: axon/NMJ overlap and arrows: NMJs lacking axon overlap. j Sibling control, dmd−/− and dmd−/−:Tg(503unc:fhl2b-T2A-EGFP) larvae immunolabeled for SV2 and α-bungarotoxin. Arrowheads: SV2+/α-bungarotoxin+ NMJs. k Quantifications of α-bungarotoxin+ NMJs where p < 0.0001 for dmd−/− vs sibling control and p = 0.0008 for dmd−/− vs dmd-/-:Tg(503unc:fhl2b-T2A-EGFP). l Quantifications of SV2+/α-bungarotoxin+ NMJs where p = 4.6e−5 for dmd−/− vs sibling control, p = 0.044 for dmd−/−:Tg(503unc:fhl2b-T2A-EGFP) vs sibling control and p = 0.024 for dmd−/− vs dmd-/-:Tg(503unc:fhl2b-T2A-EGFP). m Filament reconstruction of acetylated tubulin labeled sibling control, dmd−/− and dmd−/−:Tg(503unc:fhl2b-T2A-EGFP) larvae. n) Volume reconstruction of acetylated tubulin/α-bungarotoxin labeled sibling control, dmd−/− and dmd−/−:Tg(503unc:fhl2b-T2A-EGFP). o Quantification of total axon filament length based on reconstructions in (m) where p = 0.014 for dmd−/− vs sibling control and p = 9.7e−5 for dmd−/− vs dmd-/-:Tg(503unc:fhl2b-T2A-EGFP). p Quantification of total axon volume based on reconstructions in (n) where p = 0.0005 for dmd−/− vs sibling control, p = 0.043 for dmd−/−;Tg(503unc:fhl2b-T2A-EGFP) vs sibling control and p = 0.002 for dmd−/− vs dmd-/-;Tg(503unc:fhl2b-T2A-EGFP). Statistical analysis: Two-sided t-tests with Welch correction. Trunk region viewed is indicated in illustration above. Scale bar in g, h, m, n: 50 µm, i, j: 25 µm. Schematic images were adapted from https://www.biorender.com.
|