IMAGE

Fig. 4

ID
ZDB-IMAGE-240306-62
Source
Figures for Dennhag et al., 2024
Image
Figure Caption

Fig. 4 
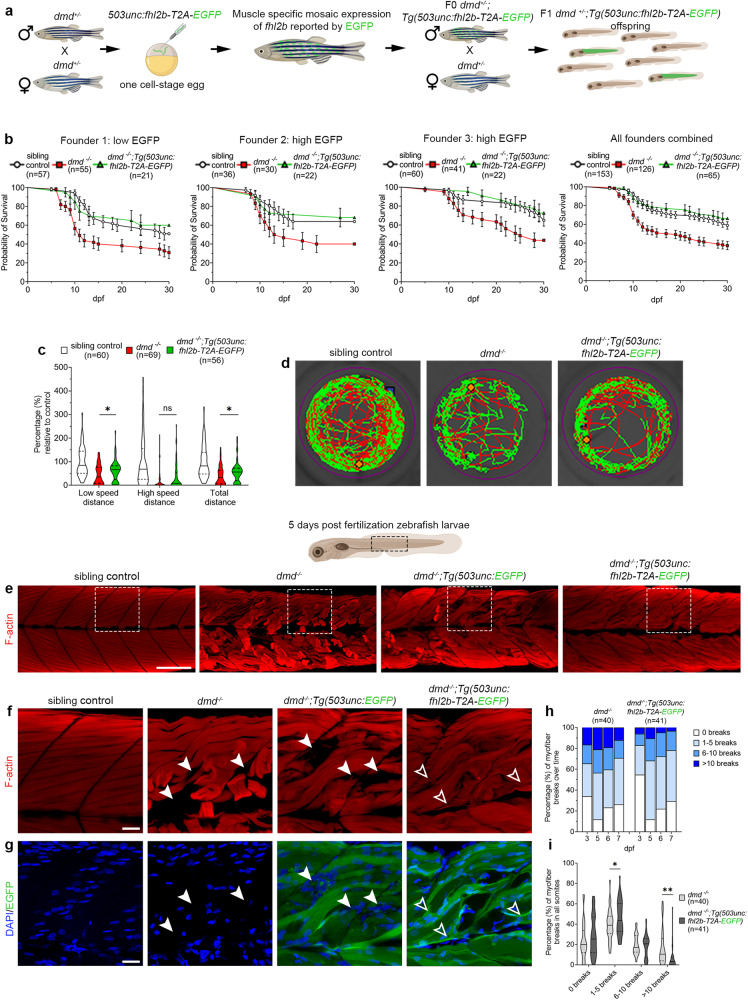
Muscle specific overexpression of fhl2b significantly prolongs life-span and improves motor function and muscle integrity in dmd−/− zebrafish larvae.

a Experimental setup to generate dmd−/− zebrafish overexpressing fhl2b. One cell-stage eggs from in-crossed dmd+/- zebrafish were injected with a 503unc:fhl2b-T2A-EGFP plasmid, raised and crossed into dmd+/- to generate stable lines. b Survival tests over 30 days for three different 503unc:fhl2b-T2A-EGFP lines. Kaplan-Meier log rank test was used to calculate significance between dmd−/− and dmd−/−:Tg(503unc: fhl2b-T2A-EGFP) for each of the three founder lines (Founder 1: p = 0.0228, Founder 2: p = 0.0534, Founder 3: p = 0.0188 and all founder lines combined: p < 0.0001). c Spontaneous swimming tests showed significant increases in low speed (p = 0.0459) and total distance (p = 0.0385) in dmd−/−:Tg(503unc:fhl2b-T2A-EGFP) compared to dmd−/− larvae. d Representative swimming tracks of sibling control, dmd−/− and dmd−/−:Tg(503unc: fhl2b-T2A-EGFP) larvae. e F-actin (phalloidin) labeling of trunk muscle in sibling control, dmd−/−, dmd−/−:Tg(503unc:EGFP) and dmd−/−:Tg(503unc:fhl2b-T2A-EGFP) larvae. f Magnification of dashed boxes in e) showing detached myofibers and empty areas in dmd−/− and dmd−/−:Tg(503unc:EGFP) larvae (arrowheads) whereas dmd−/−:Tg(503unc: fhl2b-T2A-EGFP) larvae display g small diameter intensely EGFP positive myofibers (green) in corresponding areas (open arrowheads). DAPI in blue. h Quantification of detached F-actin+ myofibers in somite segments at 3, 5, 6 and 7 dpf. i Number of myofiber breaks per somite. In total, dmd−/−:Tg(503unc: fhl2b-T2A-EGFP) larvae show more small (1–5 breaks) myofiber detachments per somite (p = 0.0441) and less large (> 10 breaks) myofiber detachments per somite (p = 0.001) as compared to dmd−/− larvae. Statistical analysis in c, i: Two-sided t-tests with Welch correction. Data in violin plots (c, i) are presented as median (line) and quartiles (dashed line). Data in all survival graphs (b) are presented as mean ± SEM. Scale bar in e: 100 µm, f: 25 µm. Schematic images were adapted from https://www.biorender.com.

Figure Data
Acknowledgments
This image is the copyrighted work of the attributed author or publisher, and ZFIN has permission only to display this image to its users. Additional permissions should be obtained from the applicable author or publisher of the image. Full text @ Nat. Commun.