|
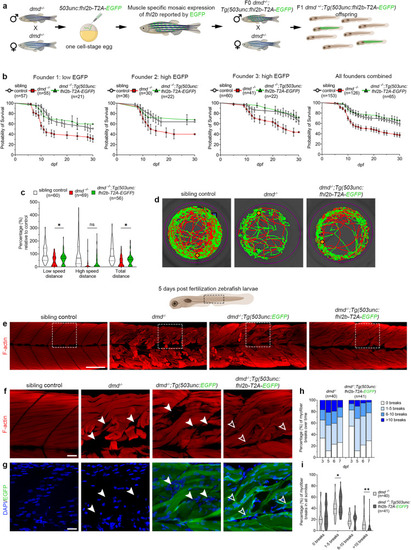
Muscle specific overexpression of fhl2b significantly prolongs life-span and improves motor function and muscle integrity in dmd−/− zebrafish larvae. a Experimental setup to generate dmd−/− zebrafish overexpressing fhl2b. One cell-stage eggs from in-crossed dmd+/- zebrafish were injected with a 503unc:fhl2b-T2A-EGFP plasmid, raised and crossed into dmd+/- to generate stable lines. b Survival tests over 30 days for three different 503unc:fhl2b-T2A-EGFP lines. Kaplan-Meier log rank test was used to calculate significance between dmd−/− and dmd−/−:Tg(503unc: fhl2b-T2A-EGFP) for each of the three founder lines (Founder 1: p = 0.0228, Founder 2: p = 0.0534, Founder 3: p = 0.0188 and all founder lines combined: p < 0.0001). c Spontaneous swimming tests showed significant increases in low speed (p = 0.0459) and total distance (p = 0.0385) in dmd−/−:Tg(503unc:fhl2b-T2A-EGFP) compared to dmd−/− larvae. d Representative swimming tracks of sibling control, dmd−/− and dmd−/−:Tg(503unc: fhl2b-T2A-EGFP) larvae. e F-actin (phalloidin) labeling of trunk muscle in sibling control, dmd−/−, dmd−/−:Tg(503unc:EGFP) and dmd−/−:Tg(503unc:fhl2b-T2A-EGFP) larvae. f Magnification of dashed boxes in e) showing detached myofibers and empty areas in dmd−/− and dmd−/−:Tg(503unc:EGFP) larvae (arrowheads) whereas dmd−/−:Tg(503unc: fhl2b-T2A-EGFP) larvae display g small diameter intensely EGFP positive myofibers (green) in corresponding areas (open arrowheads). DAPI in blue. h Quantification of detached F-actin+ myofibers in somite segments at 3, 5, 6 and 7 dpf. i Number of myofiber breaks per somite. In total, dmd−/−:Tg(503unc: fhl2b-T2A-EGFP) larvae show more small (1–5 breaks) myofiber detachments per somite (p = 0.0441) and less large (> 10 breaks) myofiber detachments per somite (p = 0.001) as compared to dmd−/− larvae. Statistical analysis in c, i: Two-sided t-tests with Welch correction. Data in violin plots (c, i) are presented as median (line) and quartiles (dashed line). Data in all survival graphs (b) are presented as mean ± SEM. Scale bar in e: 100 µm, f: 25 µm. Schematic images were adapted from https://www.biorender.com.
|