|
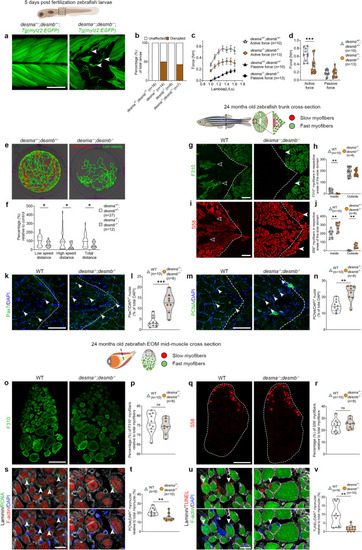
Lack of desmin causes myofiber impairment and a metabolic shift in trunk myofibers. aTg(mylz2:EGFP);desma−/−;desmb−/− and desma+/-;desmb+/- larvae exposed to resistance swimming during 12 h from 4 to 5 dpf. Arrowheads: myofiber breaks. b Proportions of injuries caused by resistance swimming. c Force generation of desma+/-;desmb+/- and desma−/−;desmb−/− trunk myofibers. d Force generated at optimal stretch in desma+/-;desmb+/- and desma−/−;desmb−/− (p = 0.002). e Representative swimming tracks of desma−/−;desmb−/− and desma+/-;desmb+/- controls. f Relative swimming distance at low speed (p = 0.024), high speed (p = 0.019) and total distance (p = 0.016). g F310 trunk immunolabeling of desma−/−;desmb−/− and WT. Open arrowheads: F310+ myofibers inside the slow domain, arrowheads: lack of F310 labeling in the fast domain. h Comparison of number of fast myofibers inside (p = 0.0018) and outside the slow domain. i S58 trunk immunolabeling in desma−/−;desmb−/− and WT. Open arrowheads: lack of slow myofibers in the slow domain, arrowheads: S58+ myofibers in the fast domain. j Quantification of number of slow myofibers inside (p = 0.002) and outside (p = 0.0012) of the slow domain. k WT and desma−/−;desmb−/− trunk immunolabeled for DAPI/Pax7. Arrowheads: Pax7+ nuclei. l Quantification of Pax7+/DAPI+ cells (p = 0.0008). m Cross-sections of WT and desma−/−;desmb−/− trunk immunolabeled for DAPI/PCNA. Arrowheads: PCNA+ nuclei. n Quantification of PCNA+/DAPI+ cells (p = 0.0028). o Cross-sections of WT and desma−/−;desmb−/− EOMs immunolabeled for F310. p Quantification of F310+ myofibers. q Cross-sections of WT and desma−/−;desmb−/− EOMs immunolabeled for S58. r Quantification of S58+ myofibers. s DAPI/PCNA/laminin/phalloidin immunolabeling of desma−/−;desmb−/− and WT EOMs. Arrowheads: DAPI+/PCNA+ myonuclei. t Quantification of DAPI+/PCNA+ myonuclei (p = 0.0039). u DAPI/TUNEL/laminin/phalloidin immunolabeling of desma−/−;desmb−/− and WT EOMs. Arrowheads: DAPI+/TUNEL+ myonuclei. v Quantification of DAPI+/TUNEL+ myonuclei (p = 0.0032). Statistical analysis: Two-sided t-tests with Welch correction. Data in violin plots is presented as median (line) and quartiles (dashed lines). Data in (c) is presented as mean ± SEM. Dashed lines in cross-sections: myosepta separating fast and slow domains. Age of fish, tissue analyzed, viewed area and level of cross-section is illustrated above panels. Scale bars in a, o, q: 100 µm, g, i, k, m: 50 µm, s, u: 25 µm. Schematic images were adapted from https://www.biorender.com.
|