|
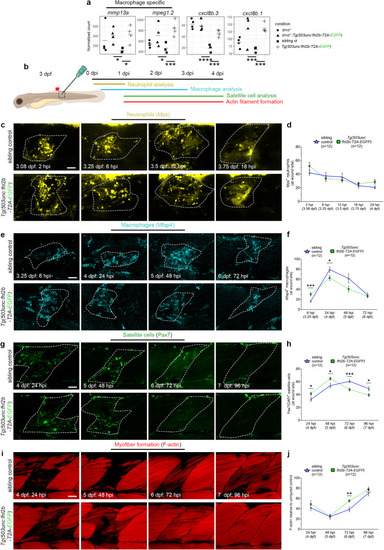
Muscle wound healing is enhanced in fhl2b overexpressing larvae. a Normalized counts for mmp13a (p.adj=0.012, p.adj=0.023), mpeg1.2 (p.adj=0.015, p.adj=0.0009), cxcl8b.3 (p.adj=7.4e−8, p.adj=0.0007) and cxcl8b.1 (p.adj=0.0005, p.adj=0.0001). Comparisons were made between dmd−/−:Tg(503unc: fhl2b-T2A-EGFP) vs sibling controls (dmd+/+, dmd+/-) and Tg(503unc: fhl2b-T2A-EGFP) vs sibling controls, respectively. b Wound healing assay experimental setup indicating area of needle-stick injury and timepoints for the different analyzes presented below. c Lateral view of injured somites in sibling controls and Tg(503unc:fhl2b-T2A-EGFP) zebrafish embryos immunolabeled with neutrophil specific Mpx antibody between 2–18 hpi. Dashed lines indicate wounded areas. Quantifications of Mpx+ neutrophils at wound size is presented in d. e Lateral view of injured somites in sibling controls and Tg(503unc:fhl2b-T2A-EGFP) zebrafish embryos immunolabeled with macrophage specific antibody Mfap4 between 6–72 hpi. Dashed lines indicate wounded areas. f Quantification of Mfap4+/DAPI+ cells in sibling controls and Tg(503unc:fhl2b-T2A-EGFP) at 6 (p = 0.0019), 24 (p = 0.0374), 48 and 72 hpi. g Lateral view of injured somites in sibling controls and Tg(503unc:fhl2b-T2A-EGFP) zebrafish embryos immunolabeled with satellite cell specific Pax7antibody at 24–96 hpi. h Quantification of Pax7+/DAPI+ cells in sibling controls and Tg(503unc:fhl2b-T2A-EGFP) at 24 (p = 0.0445), 48 (p = 0.0198), 72 (p = 0.0002) and 96 hpi (p = 0.0246). i Lateral view of injured somites in sibling controls and Tg(503unc:fhl2b-T2A-EGFP) zebrafish embryos labeled with phalloidin (F-actin) at 24–96 hpi. j Quantification of F-actin intensity at wound site in sibling controls and Tg(503unc:fhl2b-T2A-EGFP) at 24, 48, 72 (p = 0.0045) and 96 hpi. Statistical analysis in a: Two-sided Wald test with B/H-correction, d, f, h, j: Two-sided t-tests with Welch correction. Data in graphs is presented as mean ± SEM. Scale bar: 25 µm. Schematic images were adapted from https://www.biorender.com.
|