
- Title
-
The absence of telomerase leads to immune response and tumor regression in zebrafish melanoma
- Authors
- Lopes-Bastos, B., Nabais, J., Ferreira, T., Allavena, G., El Ma�, M., Bird, M., Targen, S., Tattini, L., Kang, D., Yue, J.X., Liti, G., Carvalho, T.G., Godinho Ferreira, M.
- Source
- Full text @ Cell Rep.
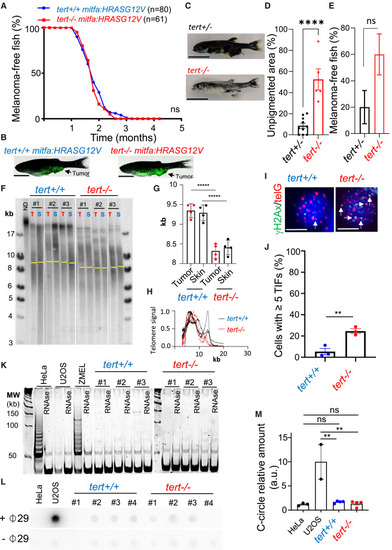
Melanoma initiation does not require a telomere maintenance mechanism (A and B) Incidence of melanoma of mitfa:HRAS fish is not affected by the lack of telomerase. (A) Percentage of tumor-free fish compared between tert+/+ and tert?/? fish (log rank test). (B) Representative images of 3-month-old tert+/+ and tert?/? fish with melanoma expressing GFP. Scale bars: 0.5 cm. (C?E) tert mRNA maternal contribution does not explain carcinogenesis in tert?/? fish. (C and D) Representative images and quantification of unpigmented skin area of mitfa:HRAS:GFP, tert+/? and tert?/? fish at 1.5 months of age. n(tert+/? = 10; tert?/? = 5); unpaired t test. Scale bars: 0.5 cm. (E) Quantification of fish with tumors at 1.5 months of age. n(tert+/? = 10; tert?/? = 5); ?2 test. (F?H) Even though telomere shortening is not apparent between skin and tumor in tert?/? fish, there is telomere shortening in tert?/? skin/tumor when compared to tert+/+ fish. However, tert?/? tumors possess higher DNA damage at telomeres. (F) Telomere restriction fragment (TRF) analysis by Southern blotting of tumor (T) and skin (S) genomic DNA extracted from 3-month-old fish (yellow bars represent mean telomere length) and (G) quantifications for mean telomere length and (H) densitometries of TRFs (n = 4; one-way ANOVA). (I) Images of ?H2Ax/telG immunofluorescence in situ hybridization (immune-FISH) of tumor cells derived from tert+/+ and tert?/? 3-month-old fish. White arrows indicate telomere dysfunction-induction foci (TIFs) in tumor cells. Scale bars: 6 ?m. (J) Percentage of cells containing ?5 TIFs from (I) (n = 3; unpaired t test). (K?M) Early-stage melanoma do not display TMMs. (K) Telomerase activity evaluated by TRAP of tumor samples derived from tert+/+ and tert?/? 3-month-old fish (n = 3). Extracts from HeLa and ZMEL cells were used as positive controls and U2OS as a negative control. (L) C-circle assay of tumor samples derived from tert+/+ and tert?/? 3-month-old fish. Extracts from HeLa cells and U2OS were used as negative and positive controls, respectively. (M) Quantification of C-circle signal (n = 4; one-way ANOVA). Error bars represent � SEM; each dot represents an individual tumor; ??p ? 0.01 and ????p ? 0.0001. ns, not significant. |
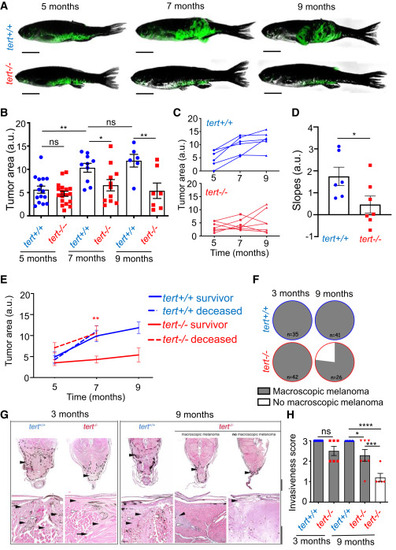
Absence of telomerase restricts tumor growth, leading to melanoma regression (A?D) Lack of telomerase impacts late tumor growth. (A) Examples of melanoma evolution over time of tert+/+ and tert?/? fish. Scale bars: 0.5 cm. (B) Quantification of tumor size of 5-, 7-, and 9-month-old tert+/+ and tert?/? fish (n ? 7; one-way ANOVA). (C) Evolution tumor size over time in individual animals (n = 6 and n = 7). (D) Slope of tumor size evolution calculated using linear regression of three time points (n ? 6; unpaired t test). (E) Larger tumors are associated with tert?/? fish lethality. Tumor size evolution of fish that either survived until 9 months (solid line: survival group) or died after 7 months (dashed line: non-survivor group). Statistics compare tert?/? survivors with tert?/? deceased fish at 7 months (n ? 7; unpaired t test). (F?H) Melanoma regresses in fish lacking telomerase. (F) tert+/+ and tert?/? fish with macroscopic tumors at 3 and 9 months of age. (G) Histopathology analysis of melanoma of 3- and 9-month-old tert+/+ and tert?/? zebrafish. Tumors are indicated by a black arrowhead and dashed line. Higher magnification shows infiltrative features of melanoma (black arrowhead), with marked invasion, destruction, and replacement of the hypaxialis muscle (white arrowhead). Top scale bar: 500 ?m, bottom scale bar: 200 ?m. (H) Quantification of melanoma invasiveness: (1) non-invasive, (2) minimally invasive, and (3) invasive (n ? 5; one-way ANOVA). Error bars represent � SEM; each dot represents an individual tumor; ?p ? 0.05, ??p ? 0.01, ???p ? 0.001, and ????p ? 0,0001. ns, not significant; a.u., arbitrary units. |
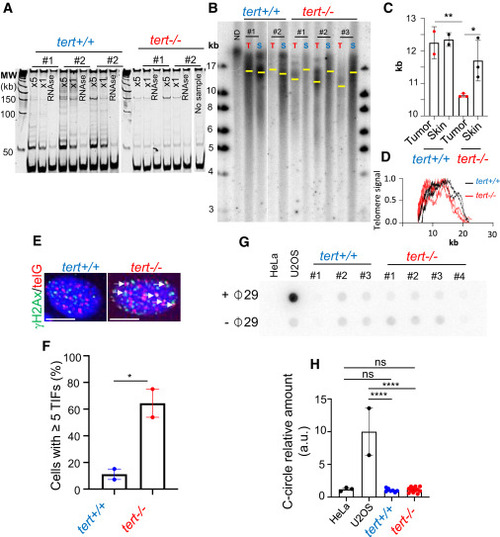
Telomerase is re-activated in late-stage melanoma, and its absence causes telomere shortening (A?D) Telomerase is active in tumors of 9-month-old fish and telomere shortening occurs in tert?/? tumors. (A) Telomerase activity evaluated by TRAP in tumor samples derived from tert+/+ and tert?/? 9-month-old fish (n = 3 and n = 2, respectively). (B) Telomere restriction fragment (TRF) analysis by Southern blotting of tumor (T) and skin (S) genomic DNA extracted from 9-month-old fish (yellow bars represent mean telomere length) and (C) quantifications for mean telomere length and (D) densitometries of TRFs (n ? 2; one-way ANOVA). (E) Images of ?H2Ax/telG immune-FISH of tumor cells derived from tert+/+ and tert?/? 9-month-old fish. White arrows indicate telomere dysfunction-induction foci (TIFs) in tumor cells. Scale bars: 6 ?m. (F) Percentage of cells containing ?5 TIFs from (B) (n = 2; unpaired t test). (G and H) Late melanoma in tert?/? fish do not engage ALT as TMM. (G) C-circle assay of tumor samples derived from tert+/+ and tert?/? 3-month-old fish. Extracts from HeLa cells and U2OS were used as negative and positive controls, respectively. (H) Quantification of C-circle signal (n ? 7; one-way ANOVA). Error bars represent � SEM; each dot represents an individual tumor; ?p ? 0.05, ??p ? 0.01, and ????p ? 0.0001. ns, not significant. |

Lack of telomerase leads to low proliferation and increased apoptosis, inflammation, and melanocyte differentiation (A) Principal-component analysis (PCA) based on untargeted transcriptomics data of tumors from 9-month-old fish. (B) Gene set enrichment analysis (GSEA) hallmarks of late-stage melanoma of tert?/? fish compared to tert+/+ highlighting inflammatory pathways, senescence, and melanocyte differentiation. (C?E) Representative immunofluorescence images and respective quantifications of tert+/+ and tert?/? tumors. Scale bars: 20 ?m. (C) DNA damage by ?H2AX, (D) proliferation by PCNA, and (E) apoptosis by cleaved caspase-3 immunofluorescence of 9-month-old fish tumors (n ? 4; unpaired t test). Error bars represent � SEM; each dot represents an individual tumor; n ? 4; ?p ? 0.05, ??p ? 0.01, and ????p ? 0.0001. |
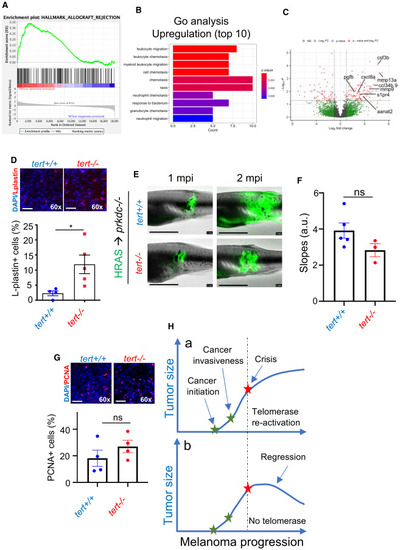
The immune system restrains growth of telomerase-deficient melanoma Telomerase-deficient tumors are strongly immunogenic. (A) Allograft rejection enrichment plot. (B) Gene Ontology (GO) enrichment analysis for upregulated genes of late-stage melanoma of tert?/? fish compared to tert+/+. (C) Volcano plot of differentially expressed genes of late-stage melanoma of tert?/? fish compared to tert+/+, highlighting genes included in leukocyte migration pathway from the GO analysis. (D) Immunofluorescence images and quantifications of immune cell infiltrates (L-plastin) of late-stage melanoma. Late-stage tert?/? melanoma is able to proliferate and grow in immunocompromised fish (n ? 4; unpaired t test). Scale bars: 20 ?m. (E) Images of immunocompromised zebrafish (prkdc?/?) engrafted with primary melanoma cells derived from 9-month-old zebrafish at 1 and 2 months post-injection (mpi). Scale bars: 0.5 cm. (F) Progression slope of tumor area calculated by a linear regression of two time points (1 and 2 mpi) (n ? 4; unpaired t test). (G) Cell proliferation of tumor cells quantified using PCNA immunofluorescence (n ? 4; unpaired t test). Scale bars: 20 ?m. (H) We propose that melanoma can initiate and progress without telomerase activation. However, once telomeres become critically short, cancer cells must activate telomerase to sustain proliferation at later stages (a). If they fail to do so, tumor growth stagnates, leading to tumor regression (b). Error bars represent � SEM; each dot represents an individual tumor; ?p ? 0.05. ns, not significant. |