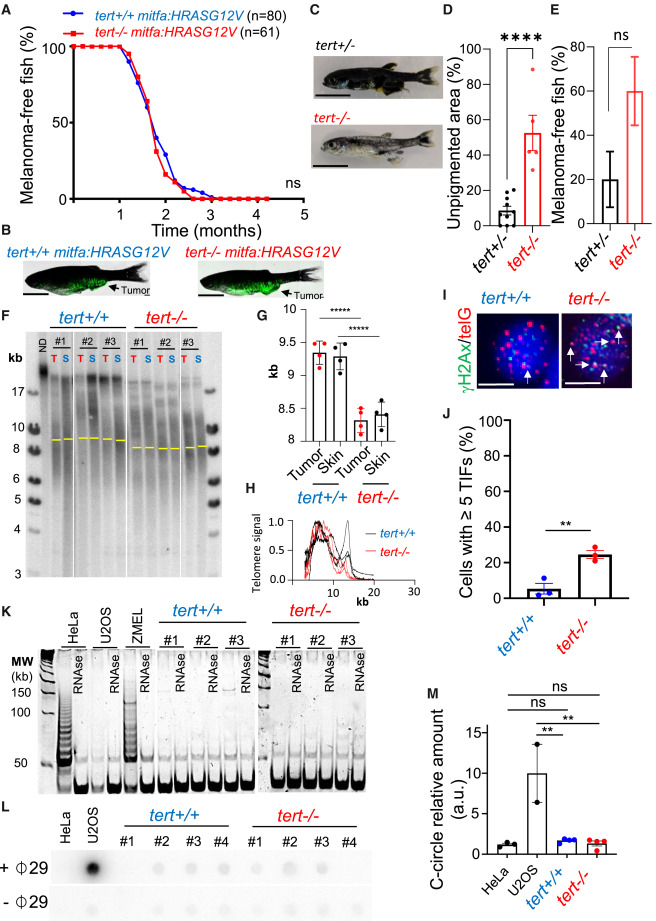
Fig. 1 Melanoma initiation does not require a telomere maintenance mechanism (A and B) Incidence of melanoma of mitfa:HRAS fish is not affected by the lack of telomerase. (A) Percentage of tumor-free fish compared between tert+/+ and tert?/? fish (log rank test). (B) Representative images of 3-month-old tert+/+ and tert?/? fish with melanoma expressing GFP. Scale bars: 0.5 cm. (C?E) tert mRNA maternal contribution does not explain carcinogenesis in tert?/? fish. (C and D) Representative images and quantification of unpigmented skin area of mitfa:HRAS:GFP, tert+/? and tert?/? fish at 1.5 months of age. n(tert+/? = 10; tert?/? = 5); unpaired t test. Scale bars: 0.5 cm. (E) Quantification of fish with tumors at 1.5 months of age. n(tert+/? = 10; tert?/? = 5); ?2 test. (F?H) Even though telomere shortening is not apparent between skin and tumor in tert?/? fish, there is telomere shortening in tert?/? skin/tumor when compared to tert+/+ fish. However, tert?/? tumors possess higher DNA damage at telomeres. (F) Telomere restriction fragment (TRF) analysis by Southern blotting of tumor (T) and skin (S) genomic DNA extracted from 3-month-old fish (yellow bars represent mean telomere length) and (G) quantifications for mean telomere length and (H) densitometries of TRFs (n = 4; one-way ANOVA). (I) Images of ?H2Ax/telG immunofluorescence in situ hybridization (immune-FISH) of tumor cells derived from tert+/+ and tert?/? 3-month-old fish. White arrows indicate telomere dysfunction-induction foci (TIFs) in tumor cells. Scale bars: 6 ?m. (J) Percentage of cells containing ?5 TIFs from (I) (n = 3; unpaired t test). (K?M) Early-stage melanoma do not display TMMs. (K) Telomerase activity evaluated by TRAP of tumor samples derived from tert+/+ and tert?/? 3-month-old fish (n = 3). Extracts from HeLa and ZMEL cells were used as positive controls and U2OS as a negative control. (L) C-circle assay of tumor samples derived from tert+/+ and tert?/? 3-month-old fish. Extracts from HeLa cells and U2OS were used as negative and positive controls, respectively. (M) Quantification of C-circle signal (n = 4; one-way ANOVA). Error bars represent ± SEM; each dot represents an individual tumor; ??p ? 0.01 and ????p ? 0.0001. ns, not significant.
Image
Figure Caption
Acknowledgments
This image is the copyrighted work of the attributed author or publisher, and
ZFIN has permission only to display this image to its users.
Additional permissions should be obtained from the applicable author or publisher of the image.
Full text @ Cell Rep.

