
Fig. 3
- ID
- ZDB-FIG-250128-49
- Publication
- Lopes-Bastos et al., 2024 - The absence of telomerase leads to immune response and tumor regression in zebrafish melanoma
- Other Figures
- All Figure Page
- Back to All Figure Page
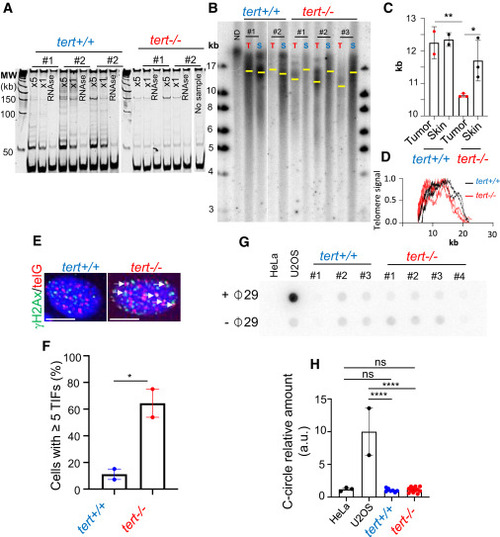
Telomerase is re-activated in late-stage melanoma, and its absence causes telomere shortening (A?D) Telomerase is active in tumors of 9-month-old fish and telomere shortening occurs in tert?/? tumors. (A) Telomerase activity evaluated by TRAP in tumor samples derived from tert+/+ and tert?/? 9-month-old fish (n = 3 and n = 2, respectively). (B) Telomere restriction fragment (TRF) analysis by Southern blotting of tumor (T) and skin (S) genomic DNA extracted from 9-month-old fish (yellow bars represent mean telomere length) and (C) quantifications for mean telomere length and (D) densitometries of TRFs (n ? 2; one-way ANOVA). (E) Images of ?H2Ax/telG immune-FISH of tumor cells derived from tert+/+ and tert?/? 9-month-old fish. White arrows indicate telomere dysfunction-induction foci (TIFs) in tumor cells. Scale bars: 6 ?m. (F) Percentage of cells containing ?5 TIFs from (B) (n = 2; unpaired t test). (G and H) Late melanoma in tert?/? fish do not engage ALT as TMM. (G) C-circle assay of tumor samples derived from tert+/+ and tert?/? 3-month-old fish. Extracts from HeLa cells and U2OS were used as negative and positive controls, respectively. (H) Quantification of C-circle signal (n ? 7; one-way ANOVA). Error bars represent � SEM; each dot represents an individual tumor; ?p ? 0.05, ??p ? 0.01, and ????p ? 0.0001. ns, not significant. |