
Fig. 2
- ID
- ZDB-FIG-250128-48
- Publication
- Lopes-Bastos et al., 2024 - The absence of telomerase leads to immune response and tumor regression in zebrafish melanoma
- Other Figures
- All Figure Page
- Back to All Figure Page
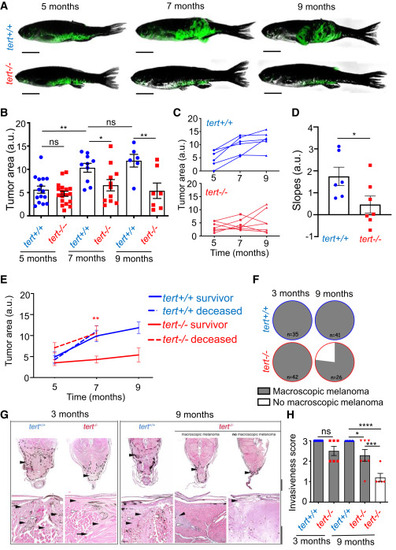
Absence of telomerase restricts tumor growth, leading to melanoma regression (A?D) Lack of telomerase impacts late tumor growth. (A) Examples of melanoma evolution over time of tert+/+ and tert?/? fish. Scale bars: 0.5 cm. (B) Quantification of tumor size of 5-, 7-, and 9-month-old tert+/+ and tert?/? fish (n ? 7; one-way ANOVA). (C) Evolution tumor size over time in individual animals (n = 6 and n = 7). (D) Slope of tumor size evolution calculated using linear regression of three time points (n ? 6; unpaired t test). (E) Larger tumors are associated with tert?/? fish lethality. Tumor size evolution of fish that either survived until 9 months (solid line: survival group) or died after 7 months (dashed line: non-survivor group). Statistics compare tert?/? survivors with tert?/? deceased fish at 7 months (n ? 7; unpaired t test). (F?H) Melanoma regresses in fish lacking telomerase. (F) tert+/+ and tert?/? fish with macroscopic tumors at 3 and 9 months of age. (G) Histopathology analysis of melanoma of 3- and 9-month-old tert+/+ and tert?/? zebrafish. Tumors are indicated by a black arrowhead and dashed line. Higher magnification shows infiltrative features of melanoma (black arrowhead), with marked invasion, destruction, and replacement of the hypaxialis muscle (white arrowhead). Top scale bar: 500 ?m, bottom scale bar: 200 ?m. (H) Quantification of melanoma invasiveness: (1) non-invasive, (2) minimally invasive, and (3) invasive (n ? 5; one-way ANOVA). Error bars represent � SEM; each dot represents an individual tumor; ?p ? 0.05, ??p ? 0.01, ???p ? 0.001, and ????p ? 0,0001. ns, not significant; a.u., arbitrary units. |