
Fig. 1
- ID
- ZDB-FIG-250128-47
- Publication
- Lopes-Bastos et al., 2024 - The absence of telomerase leads to immune response and tumor regression in zebrafish melanoma
- Other Figures
- All Figure Page
- Back to All Figure Page
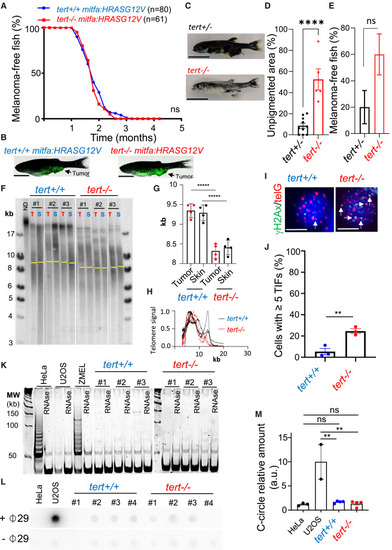
Melanoma initiation does not require a telomere maintenance mechanism (A and B) Incidence of melanoma of mitfa:HRAS fish is not affected by the lack of telomerase. (A) Percentage of tumor-free fish compared between tert+/+ and tert?/? fish (log rank test). (B) Representative images of 3-month-old tert+/+ and tert?/? fish with melanoma expressing GFP. Scale bars: 0.5 cm. (C?E) tert mRNA maternal contribution does not explain carcinogenesis in tert?/? fish. (C and D) Representative images and quantification of unpigmented skin area of mitfa:HRAS:GFP, tert+/? and tert?/? fish at 1.5 months of age. n(tert+/? = 10; tert?/? = 5); unpaired t test. Scale bars: 0.5 cm. (E) Quantification of fish with tumors at 1.5 months of age. n(tert+/? = 10; tert?/? = 5); ?2 test. (F?H) Even though telomere shortening is not apparent between skin and tumor in tert?/? fish, there is telomere shortening in tert?/? skin/tumor when compared to tert+/+ fish. However, tert?/? tumors possess higher DNA damage at telomeres. (F) Telomere restriction fragment (TRF) analysis by Southern blotting of tumor (T) and skin (S) genomic DNA extracted from 3-month-old fish (yellow bars represent mean telomere length) and (G) quantifications for mean telomere length and (H) densitometries of TRFs (n = 4; one-way ANOVA). (I) Images of ?H2Ax/telG immunofluorescence in situ hybridization (immune-FISH) of tumor cells derived from tert+/+ and tert?/? 3-month-old fish. White arrows indicate telomere dysfunction-induction foci (TIFs) in tumor cells. Scale bars: 6 ?m. (J) Percentage of cells containing ?5 TIFs from (I) (n = 3; unpaired t test). (K?M) Early-stage melanoma do not display TMMs. (K) Telomerase activity evaluated by TRAP of tumor samples derived from tert+/+ and tert?/? 3-month-old fish (n = 3). Extracts from HeLa and ZMEL cells were used as positive controls and U2OS as a negative control. (L) C-circle assay of tumor samples derived from tert+/+ and tert?/? 3-month-old fish. Extracts from HeLa cells and U2OS were used as negative and positive controls, respectively. (M) Quantification of C-circle signal (n = 4; one-way ANOVA). Error bars represent � SEM; each dot represents an individual tumor; ??p ? 0.01 and ????p ? 0.0001. ns, not significant. |