
- Title
-
Testosterone acts through membrane protein GPRC6A to cause cardiac edema in zebrafish embryos
- Authors
- Zadmajid, V., Shahriar, S., Gorelick, D.A.
- Source
- Full text @ Development
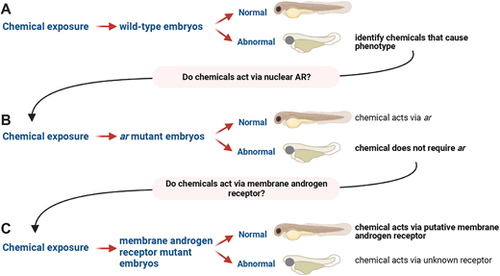
Chemical-genetic screen to identify receptors that mediate androgen-dependent phenotypes. (A) We exposed wild-type embryos to multiple androgens at different concentrations beginning at 3 h post-fertilization. We assayed embryo morphology at 2 and 3 days post-fertilization. We identified chemicals that caused morphological abnormalities. (B) We tested whether the phenotype was rescued in zebrafish with mutations in the nuclear androgen receptor gene (ar). If the phenotype was rescued, then the steroid acts via AR. (C) If the phenotype persisted in the nuclear ar mutant, then we tested zebrafish with mutations in membrane steroid receptors. To efficiently generate membrane androgen receptor mutants, we injected embryos with Cas9 and guide RNAs, exposed injected embryos to chemicals, and screened for phenotypes. After phenotypic screening, embryos were genotyped to determine mutation burden. |
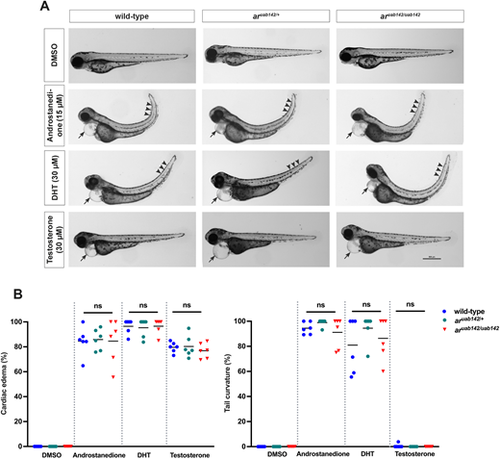
Identification of androgens that cause phenotypes in wild-type and nuclear androgen receptor (ar) mutant embryos. Wild-type or ar mutant embryos were exposed to vehicle (0.1% DMSO), 5?-androstane-3,17-dione (androstanedione), dihydrotestosterone (DHT) or testosterone, beginning at 3 h post-fertilization. (A) Representative images of embryos at 3 days post-fertilization. Cardiac edema and tail curvature are indicated by arrows and arrowheads, respectively. Each clutch was derived from heterozygous parents and contained a mix of wild-type, heterozygous aruab142/+ or homozygous aruab142/uab142 embryos. Lateral views with anterior to the left, dorsal to the top. Scale bar: 500 ?m. (B) Percentage of embryos exhibiting cardiac edema or tail curvature. Each data point is the mean percentage of embryos in a single clutch exhibiting cardiac edema or tail curvature (11-57 embryos per clutch). Clutches in the same treatment group were assayed on different days. Genotypes and treatments are separated by vertical gray dotted lines in each graph. Horizontal lines are the mean of each treatment. ns, not significant (P>0.05), one-way ANOVA with Tukey's multiple comparisons test. |
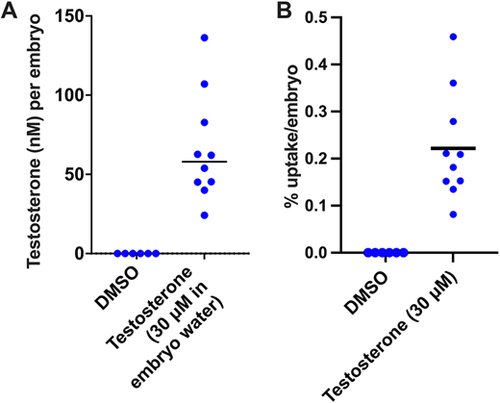
Testosterone concentration and uptake in zebrafish embryos. Wild-type embryos at 3 h post-fertilization (hpf) were exposed to vehicle (0.1% DMSO) or testosterone (30 ?M) until 3 days post-fertilization (dpf). (A,B) Testosterone levels were measured using ELISA to calculate nM testosterone per embryo (A) and percentage of testosterone uptake per embryo (B). Each circle represents the mean testosterone concentrations or uptake per embryo for a single clutch of embryos, with 50 embryos pooled per clutch. Horizontal lines are the mean of each clutch. |
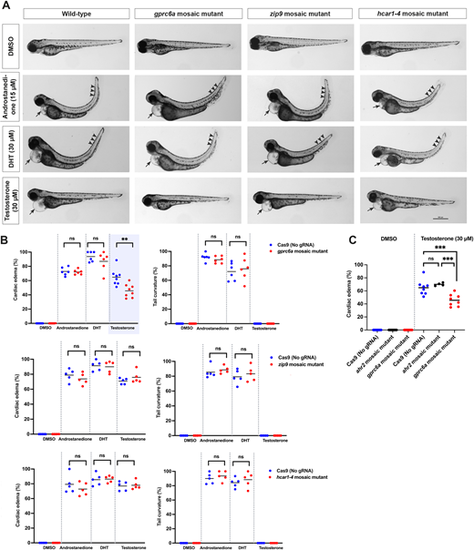
Testosterone phenotype is partially rescued by CRISPR targeting gprc6a. One-cell stage embryos were injected with Cas9 protein alone or together with a cocktail of four guide RNAs targeting different regions of the indicated genes (gprc6a, zip9 and hcar1-4). At 3 h post-fertilization, embryos were exposed to vehicle (0.1% DMSO), 5?-androstane-3,17-dione (androstanedione), dihydrotestosterone (DHT) or testosterone. (A) Representative images of embryos at 3 days post-fertilization. Cardiac edema and tail curvature are indicated by arrows and arrowheads, respectively, except in gprc6a mosaic mutants after testosterone exposure. Lateral views with anterior to the left, dorsal to the top. Scale bar: 500 ?m. (B) Percentage of embryos exhibiting cardiac edema (left graphs) or tail curvature (right graphs). Each data point is the percentage of embryos in a single clutch exhibiting cardiac edema or tail curvature (25-160 embryos per clutch). Horizontal lines are the mean of each clutch. Clutches in the same treatment group were assayed on different days. (C) As an additional control, embryos were injected with Cas9 protein alone or with guide RNAs targeting an unrelated gene (ahr2), and then exposed to vehicle or testosterone. The percentage of embryos with cardiac edema was assayed at 3 days post-fertilization. Each data point represents a single clutch (35-70 embryos per clutch). ns, not significant (P>0.05); **P<0.01, ***P<0.001; one-way ANOVA with Tukey's multiple comparisons test. |
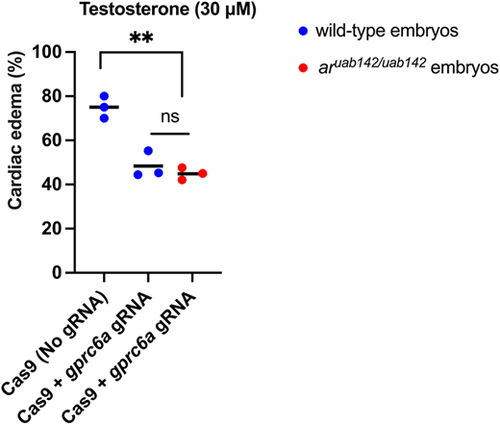
The testosterone phenotype in double mutants (gprc6a mosaic mutant+aruab142/uab142) is similar to that in the gprc6a mosaic mutant. One-cell stage aruab142/uab142 embryos were injected with Cas9 protein alone or together with a cocktail of four guide RNAs targeting different regions of the gprc6a gene. At 3 h post-fertilization, embryos were exposed to testosterone. Morphological phenotypes were assayed at 3 days post-fertilization. Each data point is the mean percentage of embryos in a single clutch exhibiting cardiac edema (19-80 embryos per clutch). Horizontal lines are the mean of each group. **P<0.01; ns, not significant (P>0.05); one-way ANOVA with Tukey's multiple comparisons test. |
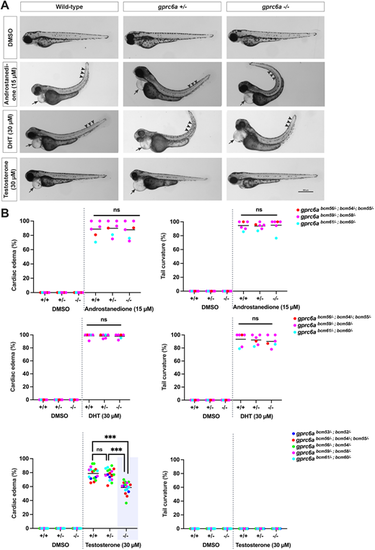
The testosterone phenotype is partially rescued in homozygous gprc6a mutants. (A) Heterozygous gprc6a adult zebrafish were crossed to each other to generate zygotic gprc6a mutants. The clutch contained a mix of wild-type and mutant embryos. Embryos were exposed to vehicle (0.1% DMSO) or 5?-androstane-3,17-dione (androstanedione), dihydrotestosterone (DHT) and testosterone, beginning at 3 h post-fertilization. Morphological phenotypes were assayed at 3 days post-fertilization, then each embryo was genotyped. Cardiac edema and tail curvature are indicated by arrows and arrowheads, respectively. Lateral views with anterior to the left, dorsal to the top. Scale bars: 500 ?m. (B) Percentage of embryos exhibiting cardiac edema (left graph) or tail curvature (right graph). Each data point is the mean percentage of embryos in a single clutch exhibiting cardiac edema or tail curvature (15-50 embryos per clutch). Clutches in the same treatment group were assayed on different days. Horizontal lines are the mean of each group. Five independently generated zygotic mutant lines are shown, where each line is a different color and each allele designation indicates a unique DNA mutation. ***P<0.001; ns, not significant (P>0.05); one-way ANOVA with Tukey's multiple comparisons test |
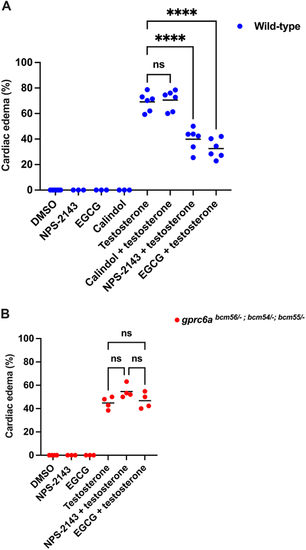
GPRC6A antagonists rescue the testosterone phenotype in wild-type embryos but have no effect in gprc6a mutants. (A) Wild-type embryos were exposed to vehicle (0.1% DMSO) or GPRC6A antagonists: calindol (5 �M), NPS-2143 (5 �M) and epigallocatechin gallate (EGCG, 100 �M) with or without testosterone (30 �M), beginning at 3 h post-fertilization. (B) Homozygous zygotic gprc6a mutant embryos were exposed to vehicle, NPS-2143 or EGCG with or without testosterone. Morphological phenotypes were assayed at 3 days post-fertilization. Antagonists failed to reduce cardiac edema in gprc6a mutant embryos. Each data point is the mean percentage of embryos in a single clutch exhibiting cardiac edema (15-25 embryos per clutch). Clutches in the same treatment group were assayed on different days. Horizontal lines are the mean of each group. ****P<0.0001; ns, not significant (P>0.05); one-way ANOVA with Tukey's multiple comparisons test. |
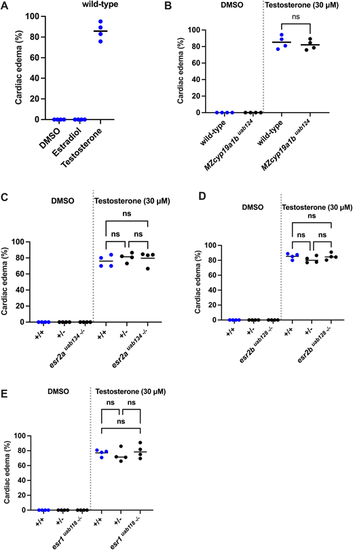
Testosterone directly acts on GPRC6A in zebrafish embryos. (A) Wild-type embryos at 3 h post-fertilization were exposed to vehicle, estradiol or testosterone. Cardiac edema was assayed at 3 days post fertilization. (B-E) Zebrafish with mutations in aromatase or nuclear estrogen receptors were exposed to testosterone and assayed for morphological phenotypes. Each data point is the mean percentage of embryos in a single clutch exhibiting cardiac edema (20-80 embryos per clutch). Clutches in the same treatment group were assayed on different days. Horizontal lines are the mean of each group. ns, not significant (P>0.05); one-way ANOVA with Tukey's multiple comparisons test. |
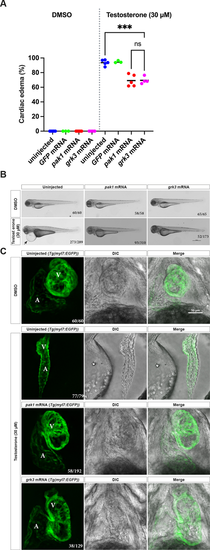
The testosterone phenotype is partially rescued by overexpression of pak1 or grk3 mRNA. (A) Wild-type embryos were injected with gfp, pak1 or grk3 mRNA. Embryos were exposed to vehicle or testosterone. Morphological phenotypes were assayed at 3 days post-fertilization. pak1 and grk3 mRNA reduced cardiac edema after testosterone exposure. Horizontal lines are the mean of each clutch. ****P<0.0001; ns, not significant (P>0.05); one-way ANOVA with Tukey?s multiple comparisons test. (B) Representative bright-field images of embryos from A at 3 days post-fertilization (dpf). Arrows indicate cardiac edema. Lateral views with anterior to the left, dorsal to the top. Fractions in the bottom right corners refer to the number of embryos with the indicated phenotype over the total number of embryos examined. Scale bar: 500 ?m. (C) Cardiac phenotypes examined on the background of Tg(myl7:EGFP) embryos after exposure to testosterone (30 �M) or vehicle controls (0.1% DMSO), beginning at 3 h post-fertilization. Representative confocal maximum intensity projections of live embryo hearts at 3 dpf. Fractions in the bottom right corners refer to the number of embryos with the indicated phenotype over the total number of embryos examined (30-75 embryos per clutch, two or three clutches per group). Myocardial cells are labeled in green; A, atrium; V, ventricle; DIC, differential interference contrast. Scale bar: 50 ?m. |
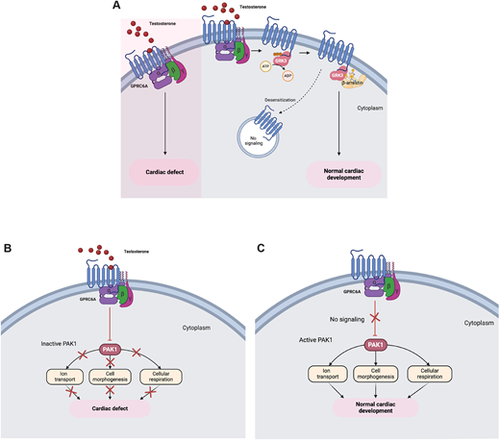
A model for the GPRC6A-mediated signaling causing a cardiac phenotype. (A) Testosterone activation of GPRC6A leads to activation of second messenger pathways that cause cardiac defects. The GPCR kinase GRK3 can reduce GPRC6A activity by promoting recruitment of ?-arrestins. (B) Testosterone-mediated activation of GPRC6A inhibits or downregulates PAK1. (C) In the absence of testosterone, GPRC6A is less active. Created in BioRender. Gorelick, D. (2024) https://BioRender.com/y70f832. |