
Image
|
Figure Caption
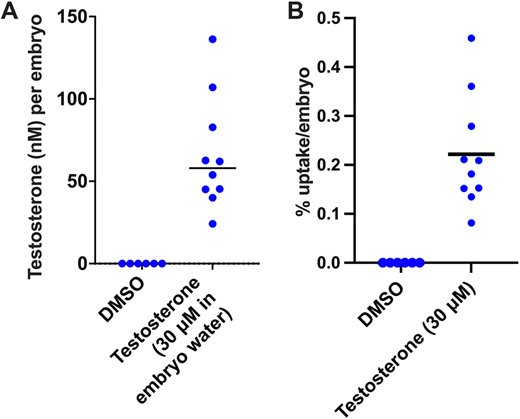
Fig. 3 Testosterone concentration and uptake in zebrafish embryos. Wild-type embryos at 3 h post-fertilization (hpf) were exposed to vehicle (0.1% DMSO) or testosterone (30 ?M) until 3 days post-fertilization (dpf). (A,B) Testosterone levels were measured using ELISA to calculate nM testosterone per embryo (A) and percentage of testosterone uptake per embryo (B). Each circle represents the mean testosterone concentrations or uptake per embryo for a single clutch of embryos, with 50 embryos pooled per clutch. Horizontal lines are the mean of each clutch.
Acknowledgments
This image is the copyrighted work of the attributed author or publisher, and
ZFIN has permission only to display this image to its users.
Additional permissions should be obtained from the applicable author or publisher of the image.
Full text @ Development