- Title
-
Tagging the tjp1a Gene in Zebrafish with Monomeric Red Fluorescent Protein Using Biotin Homology Arms
- Authors
- Davison, C., Harzman, H., Nicholson, J., Entriken, S., Mobley, K., Krull, A., Singhal, M., Skow, C., Matthews, N., Kopp, L., Gillette, B., Weide, T.J., Hukvari, J.R., Stumpf, S.C.P., Feldmann, O.M., McGrail, M., Srivastava, R., Essner, J.J.
- Source
- Full text @ Zebrafish
|
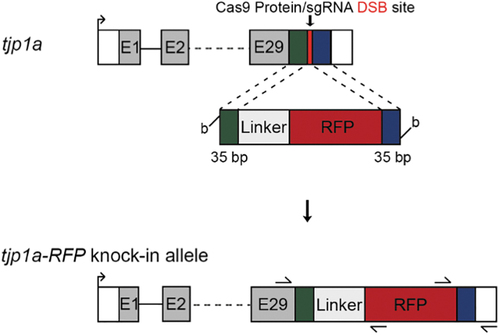
Knock-in strategy for generation of Tjp1a-mRFP fusion. The gene schematic contains blue and green boxes to represent the 5? and 3? 35 bp homology arms. The red line shows the expected double-strand break site after injection with Cas9 protein and the cr:tracRNA. Shown below is a schematic of the biotin-labeled template containing the homology arms, LGGGSGGSGASSEDV flexible linker and mRFP. The tjp1a-mRFP knock-in allele schematic depicts the expected integration at the 3? end of the tjp1a coding sequence. Arrows present on the schematic represent the primer binding sites used to generate junction fragments and verify the presence of the precise integration. mRFP, monomeric red fluorescent protein. |
|
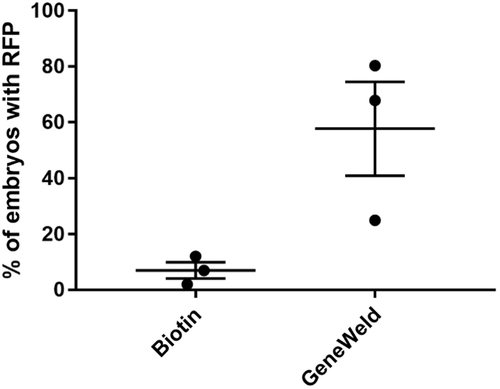
Comparison of biotin-labeled PCR generated linear template versus GeneWeld plasmid-based injections for homology directed targeted integration. The percent of embryos displaying mRFP was plotted from three separate experiments for each method. Dots represent an individual experiment, wide lines are the average, and the shorter lines are the SEM. PCR, polymerase chain reaction; SEM, standard error of the mean. |
|
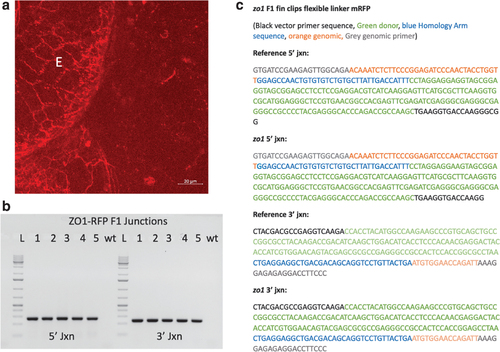
Detection of tjp1a-mRFP integration and germline transmission. (a) Confocal image of the lens of a 3 dpf embryo injected with the tjp1a-mRFP targeting template expressing mRFP. mRFP is observed at the border of cells within the lens and some surrounding structures. E designates the eye. (b) 1.2% agarose gel displaying junction fragments from a PCR run on fin clips of F1 tjp1a-mRFP is86 embryos expressing mRFP. Bands are seen at approximately the expected sizes of 270 bp and 230 bp. (c) Annotated Sanger sequencing results from sequencing of the bands shown in (b). The junction sequences recovered were color coded and compared to the reference sequence: grey, gene specific primer; black, mRFP primer; red, tjp1a gene sequence; blue, homology arms; green, mRFP sequence. |
|
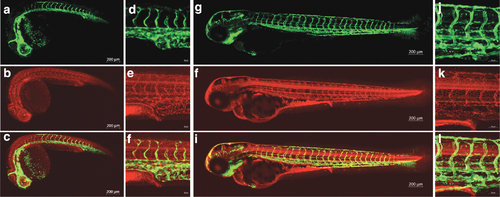
tjp1a-mRFP embryos show localization of mRFP to regions of cell?cell contact. Confocal images of mRFP (b, e, h, k), eGFP from fli1-egfpy1 (a, d, g, j), and merged (c, f, I, l) channels. (a?f) 1 dpf tjp1a-mRFPis86; fli1-egfpy1 embryos imaged with a 5x (a?c) and 20x (d?f) objective. (g?l) 3 dpf tjp1a-mRFP is86; fli1-egfpy1 embryos imaged with a 10x (g?i) and 20x (j?l) objective. All 20 × images are centered around the urogenital opening. eGFP from fli1-egfpn1 is expressed in blood vessels and mRFP from tjp1-mRFP is86 is likely present in tight junctions. mRFP was observed in blood vessels, the central nervous system, and the gut. |
|
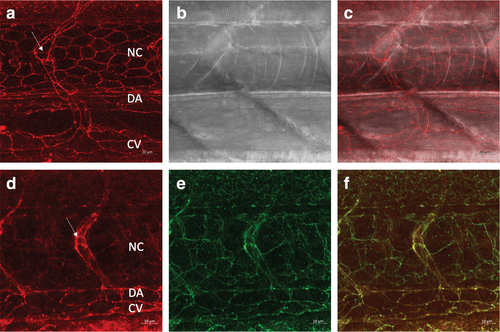
tjp1a-RFP embryos show localization of RFP to regions of cell?cell contact, and immunolabeling demonstrates that the RFP is colocalized with Tjp1a. (a?c) Confocal images of RFP in the tjp1a-RFP line in the trunk at 40 × with transmitted light in (b). Larva was 3 dpf. (d?f) Immunolabeling with anti-dsRed antibodies display a junctional pattern at 1 dpf at 63 × . (e) A similar pattern of labeling was observed with anti-Tjp1a antibodies. (f) Overlap of images in (d) and (e). NC, notochord; DA, dorsal aorta; CV, caudal vein, and the arrow indicates a segmental blood vessel. |

