- Title
-
Deficiency of Acetyltransferase nat10 in Zebrafish Causes Developmental Defects in the Visual Function
- Authors
- Yang, H.Z., Zhuo, D., Huang, Z., Luo, G., Liang, S., Fan, Y., Zhao, Y., Lv, X., Qiu, C., Zhang, L., Liu, Y., Sun, T., Chen, X., Li, S.S., Jin, X.
- Source
- Full text @ Invest. Ophthalmol. Vis. Sci.
|
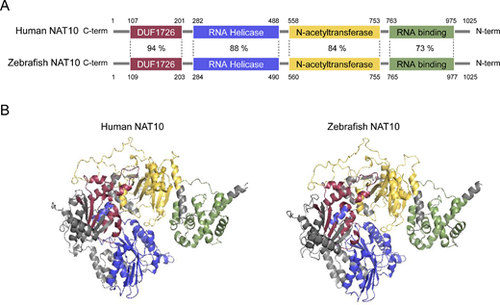
Comparative analysis of human and zebrafish NAT10 proteins. (A) Domain-wise percent sequence identity between human and zebrafish NAT10 proteins, highlighting their conserved regions. (B) Predicted three-dimensional (3D) structures of human and zebrafish NAT10 proteins using AlphaFold, with distinct domains, color-coded: DUF1726 (purple), RNA Helicase (blue), N-acetyltransferase (yellow), and RNA binding (green). |
|
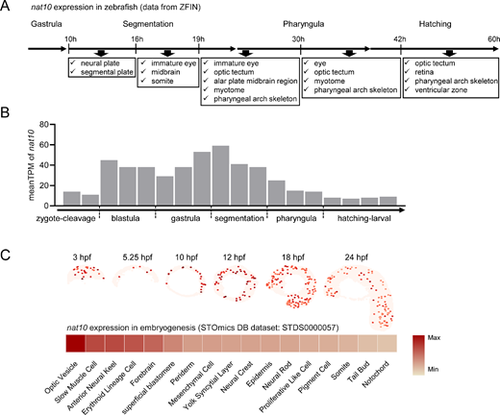
Spatiotemporal expression patterns of nat10 in zebrafish. (A) A schematic representation delineating the spatial and temporal expression of nat10 during zebrafish embryogenesis, as sourced from the Zebrafish Information Network (ZFIN, https://zfin.org/ZDB-GENE-040426-1543/expression). (B) A temporal expression profile of nat10 mRNA throughout zebrafish embryonic development, derived from the Expression Atlas dataset (http://www.ebi.ac.uk/gxa/experiments/E-ERAD-475). (C) A comprehensive mapping of the spatiotemporal distribution of nat10 expression in zebrafish embryogenesis using a dataset from the STOmics DB (https://db.cngb.org/stomics/datasets/STDS0000057). Upper panel: A detailed depiction of the spatial distribution of nat10 expression across progressive developmental stages. Lower panel: A heatmap illustrating the mean expression levels of nat10 in various spatial regions. |
|
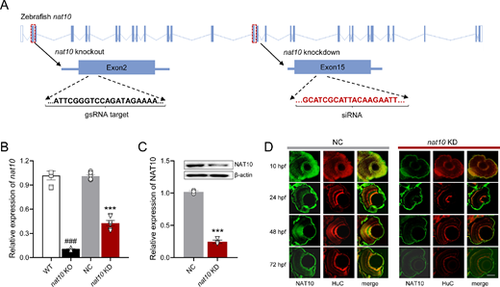
Disruption of nat10 in zebrafish via CRISPR/Cas9 and siRNA. (A) Illustrates the genomic structure of the zebrafish nat10 gene, highlighting the CRISPR/Cas9 target site in exon 2 (orange underline) and the siRNA target site in exon 15 (red underline) for knockout and knockdown, respectively. (B) Quantitative analysis of nat10 mRNA expression levels in wild-type (WT), nat10 knockout (KO), negative control (NC), and nat10 knockdown (KD) zebrafish using real-time PCR. Results are presented as mean ▒ SEM from six independent experiments. Statistical analysis was performed using 1-way ANOVA with the Tukey post hoc test; ###P < 0.001 vs. WT, ***P < 0.001 vs. NC. (C) Western blot analysis of NAT10 protein expression in NC and nat10 KD zebrafish. Data are expressed as mean ▒ SEM from 3 independent experiments, analyzed with an unpaired two-tailed Student?s t-test; **P < 0.01 vs. NC. (D) Histological sections stained with NAT10 (green) and HuC (red) from NC and nat10 KD zebrafish retinas at 10 hpf, 24 hpf, 48 hpf, and 72 hpf. Scale bar = 50 Ám. |
|
Impact of nat10 deficiency on zebrafish embryonic development. (A) Displays the morphological phenotypes observed in WT, nat10 KO, NC, and nat10 KD zebrafish at 48 and 72 hours post-fertilization (hpf). Percent survival (B), percent hatching (C), body length (D), and percent tail bending (E) were compared among these groups. Results are presented as mean ▒ SEM from six independent experiments. Statistical analysis was performed using 1-way ANOVA with the Tukey post hoc test; ###P < 0.001 vs. WT, ***P < 0.001 vs. NC. PHENOTYPE:
|
|
The nat10 KD induces anxiety-like behaviors in zebrafish larvae. (A) A representative heat map traces the open field behavior over 10 minites, comparing NC and nat10 KD zebrafish larvae; the upper and lower panels show NC and nat10 KD larvae, respectively. Behavioral parameters assessed in the open field test include (B) total distance moved, (C) time spent in the center, and (D) percentage of time in the border area. (E) A representative heat map traces from the light-dark preference test over 10 minutes; upper and lower panels for NC and nat10 KD larvae, respectively. Behavioral parameters assessed in the light-dark preference test are (F) percentage of time in the light zone and (G) in the dark zone. (H) A representative heat map traces from the novel tank diving test over 10 minutes, upper and lower panels for NC and nat10 KD larvae, respectively. Analyzed behaviors in the novel tank diving test include (I) the number of entries into the top zone and (J) the percentage of time spent there. Results are presented as mean ▒ SEM from 9 to 11 independent experiments. Statistical analysis was performed using an unpaired two-tailed Student's t-test; *P < 0.0, ***P < 0.001 vs. NC. |
|
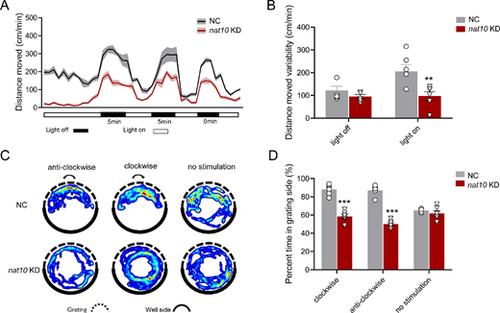
Effect of nat10 KD on visual perception in zebrafish larvae. (A) Graph illustrating the locomotor response of zebrafish larvae to alternating light-dark conditions, with periods of 5 minutes each in darkness and light. The plot graph compares the average distances moved by larvae in the NC and the nat10 KD groups, with the shaded areas representing the standard error of the mean (SEM). (B) Analyze the variability in movement during dark-light and light-dark transitions between the NC and the nat10 KD groups. Results are presented as mean ▒ SEM from six independent experiments. Statistical analysis was performed using 2-way ANOVA with the Tukey post hoc test; **P < 0.001 vs. NC. (C) Representative heat map images showing the optomotor responses of zebrafish larvae to rotating grating over 5 minutes; upper and lower panels for the NC and the nat10 KD zebrafish larvae, respectively. (D) The percentage of time zebrafish larvae spent on the grating side was in the NC and the nat10 KD groups. Results are presented as mean ▒ SEM from six independent experiments. Statistical analysis was performed using 2-way ANOVA with the Tukey post hoc test; ***P < 0.001 vs. NC. |
|
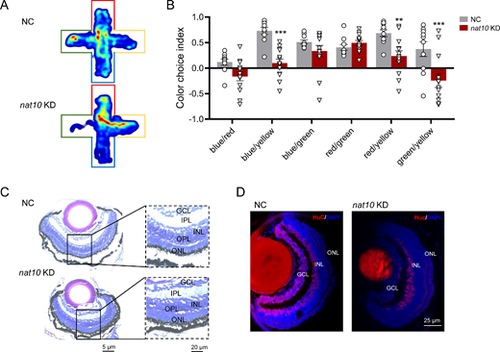
Influence of nat10 KD on color preference and retinal morphology in zebrafish. (A) Representative heat map images showing the innate color preference behavior of zebrafish in a 10 minutes test within a plus-maze, each arm of which is covered with red, blue, yellow, and green sleeves; upper and lower panels for the NC and the nat10 KD zebrafish larvae, respectively. (B) The calculation of the color choice index is based on the ratio of time spent in each two-color combination. Results are presented as mean ▒ SEM from 10 independent experiments. Statistical analysis was performed using 2-way ANOVA with the Tukey post hoc test; **P < 0.001, ***P < 0.001 vs, NC. (C) Coronal sections of the retinas from the NC (upper panel) and the nat10 KD (lower panel) zebrafish larvae; GCL, ganglion cell layer; INL and ONL, inner and outer nuclear layer, respectively; IPL and OPL, inner and outer plexiform layers. (D) Immunofluorescence staining of the retinas of the NC (left panel) and the nat10 KD (right panel) zebrafish larvae with elavl3 (red) and DAPI (blue). |
|
Transcriptomic profiling of nat10 KD in zebrafish larvae. (A) Volcano plots illustrate the differential gene expression between the NC and the nat10 KD zebrafish larvae. Differentially expressed genes, indicated by P < 0.05 and a log2 fold change (log2FC) ?2 (downregulated genes in blue, upregulated genes in red, and nonsignificant changes in gray). (B) A hierarchical heatmap shows the differential expression patterns in 4 independent NC and nat10 KD samples, with color intensity indicating fold changes; upregulation and downregulation are marked in red and blue, respectively. (C) Gene Ontology (GO) enrichment analysis for genes differentially expressed in nat10 KD larvae, showing the top 5 GO terms in four categories ranked by enrichment score. The right panel shows a heatmap of genes associated with the phototransduction GO term, with a color scale reflecting log2FC. (D) Quantitative real-time RT-PCR validation of mRNA levels for key differentially expressed genes in phototransduction. Results are presented as mean ▒ SEM from six independent experiments. Statistical analysis was performed using 1-way ANOVA with the Tukey post hoc test; ***P < 0.001 vs. NC. (E) Construction of a protein-protein interaction network for the phototransduction interactome using STRING database. |
|
Impact of nat10 KD on ac4C levels and mRNA stability in opsins. (A) Right panel: A representative dot blot displaying ac4C levels in total RNA from the NC and nat10 KD zebrafish larvae. Left panel: Quantitative analysis of ac4C content in total RNA from both the NC and the nat10 KD groups, with results shown as mean ▒ SEM from eight independent experiments. Statistical analysis was performed using an unpaired two-tailed Student's t-test; ***P < 0.001 vs. NC. (B, C) RNA immunoprecipitation-PCR (RIP-PCR) analysis illustrating ac4C modifications in specific opsin mRNAs (opn1sw1, opn1sw2, opn1mw1, opn1mw2, opn1lw2, prph2b, and rom1a) in the NC and nat10 KD larvae, presented as mean ▒ SEM from six independent experiments. Statistical analysis was performed using 2-way ANOVA with the Tukey post hoc test; ***P < 0.001 vs. NC. (D, E) The stability of opn1sw1 (D) and opn1mw1 (E) mRNAs at five time points (0-12 hours) after actinomycin-D treatment, was quantified via RT-PCR. Results are presented as mean ▒ SEM from six independent experiments, with mean terminal half-lives (t1/2) indicated. Statistical analysis was performed using 2-way ANOVA with the Tukey post hoc test; *P < 0.001, ***P < 0.001 vs. NC. |

