Image
Figure Caption
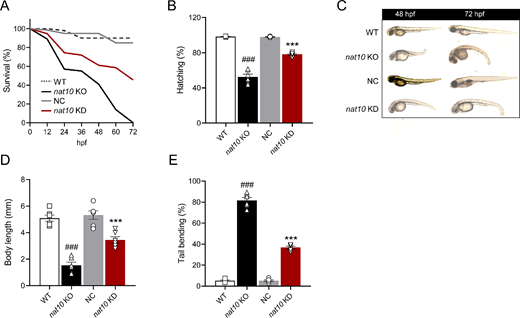
Fig. 4 Impact of nat10 deficiency on zebrafish embryonic development. (A) Displays the morphological phenotypes observed in WT, nat10 KO, NC, and nat10 KD zebrafish at 48 and 72 hours post-fertilization (hpf). Percent survival (B), percent hatching (C), body length (D), and percent tail bending (E) were compared among these groups. Results are presented as mean ± SEM from six independent experiments. Statistical analysis was performed using 1-way ANOVA with the Tukey post hoc test; ###P < 0.001 vs. WT, ***P < 0.001 vs. NC.
Figure Data
Acknowledgments
This image is the copyrighted work of the attributed author or publisher, and
ZFIN has permission only to display this image to its users.
Additional permissions should be obtained from the applicable author or publisher of the image.
Full text @ Invest. Ophthalmol. Vis. Sci.

