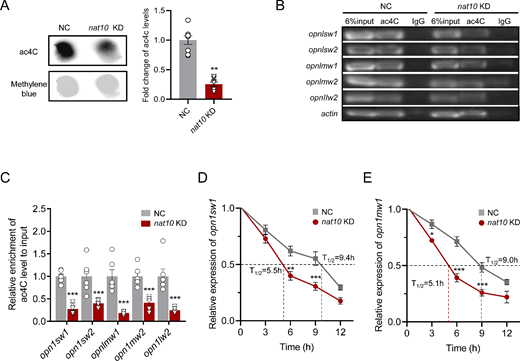
Fig. 9 Impact of nat10 KD on ac4C levels and mRNA stability in opsins. (A) Right panel: A representative dot blot displaying ac4C levels in total RNA from the NC and nat10 KD zebrafish larvae. Left panel: Quantitative analysis of ac4C content in total RNA from both the NC and the nat10 KD groups, with results shown as mean ± SEM from eight independent experiments. Statistical analysis was performed using an unpaired two-tailed Student's t-test; ***P < 0.001 vs. NC. (B, C) RNA immunoprecipitation-PCR (RIP-PCR) analysis illustrating ac4C modifications in specific opsin mRNAs (opn1sw1, opn1sw2, opn1mw1, opn1mw2, opn1lw2, prph2b, and rom1a) in the NC and nat10 KD larvae, presented as mean ± SEM from six independent experiments. Statistical analysis was performed using 2-way ANOVA with the Tukey post hoc test; ***P < 0.001 vs. NC. (D, E) The stability of opn1sw1 (D) and opn1mw1 (E) mRNAs at five time points (0-12 hours) after actinomycin-D treatment, was quantified via RT-PCR. Results are presented as mean ± SEM from six independent experiments, with mean terminal half-lives (t1/2) indicated. Statistical analysis was performed using 2-way ANOVA with the Tukey post hoc test; *P < 0.001, ***P < 0.001 vs. NC.
Image
Figure Caption
Acknowledgments
This image is the copyrighted work of the attributed author or publisher, and
ZFIN has permission only to display this image to its users.
Additional permissions should be obtained from the applicable author or publisher of the image.
Full text @ Invest. Ophthalmol. Vis. Sci.

