
|
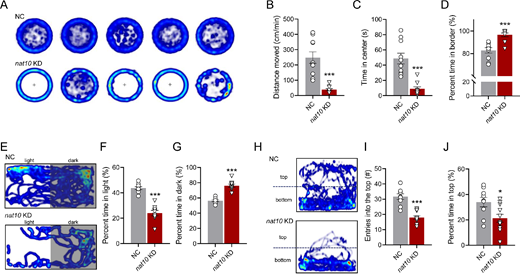
Fig. 5 The nat10 KD induces anxiety-like behaviors in zebrafish larvae. (A) A representative heat map traces the open field behavior over 10 minites, comparing NC and nat10 KD zebrafish larvae; the upper and lower panels show NC and nat10 KD larvae, respectively. Behavioral parameters assessed in the open field test include (B) total distance moved, (C) time spent in the center, and (D) percentage of time in the border area. (E) A representative heat map traces from the light-dark preference test over 10 minutes; upper and lower panels for NC and nat10 KD larvae, respectively. Behavioral parameters assessed in the light-dark preference test are (F) percentage of time in the light zone and (G) in the dark zone. (H) A representative heat map traces from the novel tank diving test over 10 minutes, upper and lower panels for NC and nat10 KD larvae, respectively. Analyzed behaviors in the novel tank diving test include (I) the number of entries into the top zone and (J) the percentage of time spent there. Results are presented as mean ± SEM from 9 to 11 independent experiments. Statistical analysis was performed using an unpaired two-tailed Student's t-test; *P < 0.0, ***P < 0.001 vs. NC.