- Title
-
Loss of mitochondrial Chchd10 or Chchd2 in zebrafish leads to an ALS-like phenotype and Complex I deficiency independent of the mitochondrial integrated stress response
- Authors
- Légaré, V.P., Rampal, C.J., Gurberg, T.J.N., Aaltonen, M.J., Janer, A., Zinman, L., Shoubridge, E.A., Armstrong, G.A.B.
- Source
- Full text @ Dev. Neurobiol.
|
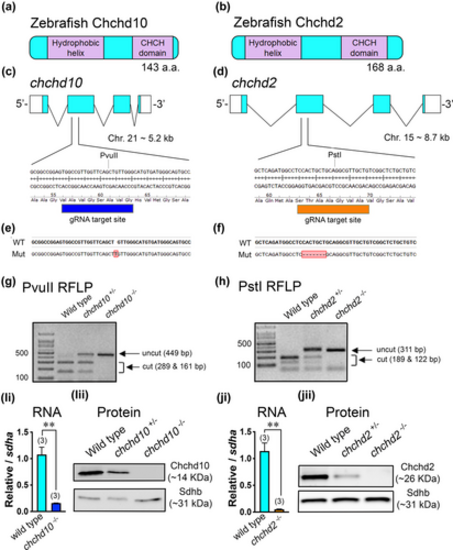
Generation of chchd10?/? and chchd2?/? zebrafish lines. Schematic representation of the zebrafish proteins Chchd10 (a) and Chchd2 (b). (c) chchd10 gene structure and guide RNA (gRNA) target site. (d) chchd2 gene structure and gRNA target site. (e) CRISPR-induced chchd10?/? mutant (mut) line. (f) CRISPR-induced chchd2?/? mutant (mut) line. (g) Restriction fragment length polymorphism (RFLP) screening method using PvuII which is lost in the chchd10?/? mutant. (h) RFLP screening using PstI which is lost in the chchd2?/? mutant. (Ii) RT-qPCR of the chchd10 transcript using wild type and chchd10?/? cDNA. A reduction in chchd10 (t-test, p = .003, relative to sdha) was observed in chchd10?/? (data represents as mean ± SEM). (Iii) Immunoblot using wild type, chchd10+/?, and chchd10?/? whole brain lysate. Sdhb was used as a loading control. (Ji) RT-qPCR of the chchd2 transcript from wild type and chchd2?/? cDNA. A significant reduction in chchd2 (t-test, p = .002, relative to sdha) was observed in chchd2?/? (data represents mean ± SEM). (Jii) Brain lysate immunoblot from wild type, chchd2+/?, chchd2?/? model. Sdhb was used as a loading control. Significant differences from wild type larval data are represented by either a single asterisk (p < .05) or double asterisk (p < .01), and samples sizes (n) are in parentheses.
|
|
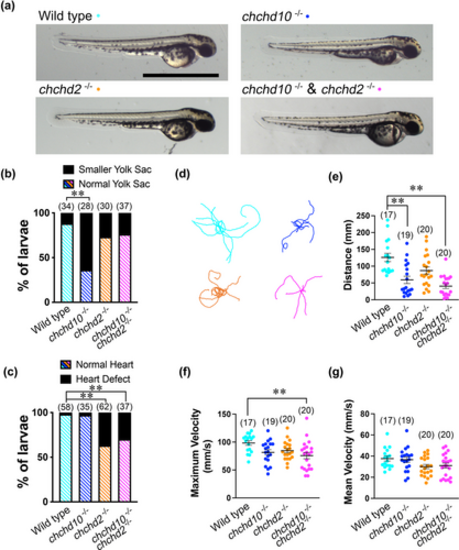
Larval chchd10?/?, chchd2?/?, and double chchd10?/? and chchd2?/? display morphological defects and motor impairment. (a) Representative images of 56 hpf larvae. (b) Quantification of yolk sacs defects. Larval chchd10?/? showing reduced yolk sack size compared to wild type larvae (p < .0001). (c) Quantification of heart defects. Both chchd2?/? (p < .0001) and double chchd10?/? and chchd2?/? (p < .0001) larvae display cardiac abnormalities. (d) Representative traces of touch-evoked motor response 2 dpf larvae (n = 10 per genotype). Quantification of swim distance with wild type larvae swimming for significantly longer distances than chchd10?/? (p = .0016) and double chchd10?/? and chchd2?/? (p = .0089) larvae (e). Quantification of maximum swim velocity revealed that wild type larvae swam at a maximum velocity that was significantly faster than double chchd10?/? and chchd2?/? (p = .0063) larvae (f). No differences were found when examining mean swim velocity across our genetic groupings (g). Data shown as individual data points ± SEM. Significance was assessed using Kruskal?Wallis test followed by Dunn's post hoc test for swimming distance or by one-way ANOVA and Tuckey's multiple comparison test for maximum velocity and mean distance measures. Significant differences from wild type larvae are represented by either a single asterisk (p < .05) or double asterisk (p < .01), and samples sizes (n) are in parentheses.
|
|
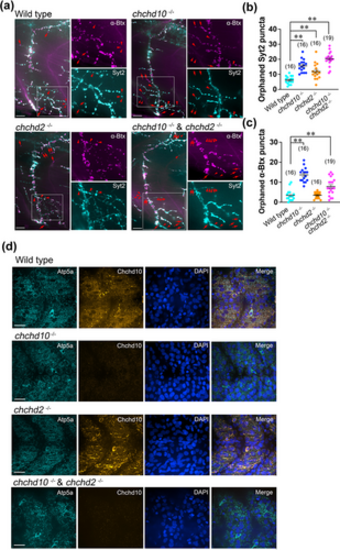
Larval chchd10?/?, chchd2?/?, and double chchd10?/? and chchd2?/? display altered neuromuscular junction (NMJ) integrity, but no obvious mitochondrial network alterations. (a) Representative images of larval ventral trunk NMJs and mitochondrial network in 2 dpf zebrafish. Markers are Syt2 (cyan, presynaptic) and ?Btx (magenta, postsynaptic). Red arrows and red arrowheads in example NMJ images represent orphaned ?Btx and Syt2 puncta, respectively. Scale bars represent 100 ?m. (b) Tabulation of orphaned presynaptic (Syt2) puncta. All genetic groups were significantly different than wild type NMJs (chchd10?/?, p < .0001; chchd2?/?, p = .0281; double chchd10?/? and chchd2?/?, p < .0001). Data shown as mean ± SEM. (c) Tabulation of orphaned postsynaptic (?Btx) puncta. Both chchd10?/? and double chchd10?/? and chchd2?/? showed increased orphaned AChR clusters when compared to wild type larvae (chchd10?/?, p < .0001; double chchd10?/? and chchd2?/?, p = .0069). Data shown as mean ± SEM. Sample sizes (n) are noted in parentheses. Significance was assessed using a one-way ANOVA and Tuckey's multiple comparison test, and significant differences from wild type larvae are represented by either a single asterisk (p < .05) or double asterisk (p < .01). (d) Representative confocal images of the mitochondrial network in the superficially located slow-twitch muscle cell layer. Markers are Atp5a (cyan), DAPI (blue), and Chchd10 (orange). Scale bars represent 40 ?m.
|
|
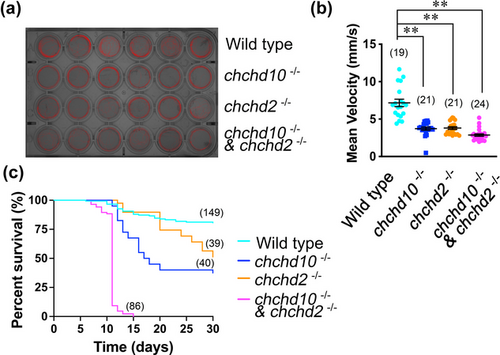
All mutant larvae present a motor deficit at 5 dpf and reduced survival. (a) Representative image of a 24-well plate free swim arena and movement paths (6 per genotype) of larvae aged 5 dpf. (b) Quantification of mean velocity. Specific mean swim velocities are as follows: wild type, 7.17 mm/s; chchd10?/?, 3.72 mm/s; chchd2?/?, 3.80 mm/s, and double chchd10?/? and chchd2?/?, 2.87 mm/s. All mutant zebrafish swam at significantly lower mean velocities when compared to wild type zebrafish (chchd10?/?, p = .0002; chchd2?/?, p = .0002; double chchd10?/? and chchd2?/?, p < .0001). Data represented as individual data points ± SEM. A Kruskal?Wallis test was used to assess significance followed by a Dunn's multiple comparisons test. Sample sizes (n) are noted in parentheses. Double asterisks represent p < .01. (c) Survival rates were significantly reduced in all mutants, with no double chchd10?/? and chchd2?/? surviving past 15 days. Significance was assessed using Mantel?Cox test, and all data points were compared to wild type survival (chchd10?/?, p < .0001; chchd2?/?, p = .0005; double chchd10?/? and chchd2?/?, p < .0001). Sample sizes (n) are noted in parentheses.
|
|
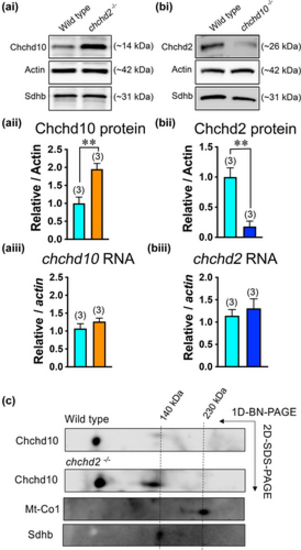
Larval Chchd10 compensates for loss of Chchd2 expression but not vice versa and is present in both a lower and higher molecular weight complex in zebrafish at 5 dpf. (ai) Representative immunoblot of Chchd10 protein level in chchd2?/? larvae aged 5 dpf. (aii) Immunoblot quantification (5 dpf) showing increased Chchd10 expression compared to wild type in chchd2?/? larvae (t-test, p = .011). Actin was used as loading control. (aiii) Unchanged transcript levels of chchd10 in 5 dpf chchd2?/? larvae (t-test, p = .30 relative to actin). (bi) Representative immunoblot of Chchd2 protein expression in chchd10?/? larvae aged 5 dpf. (bii) Immunoblot quantification (5 dpf) showing reduced Chchd2 expression levels in chchd10?/? larvae compared to wild type larvae (t-test, p = .001). Actin was used as loading control. (biii) Unchanged transcript levels of chchd2 in 5 dpf chchd10?/? larvae (t-test, p = .55, relative to actin). (c) Second dimensional PAGE analysis using a Chchd10 antibody revealed a high molecular weight complex, close to 140 kDa, in both wild type and chchd2?/? larvae. Mt-Co1 and Sdhb are used as molecular weight markers. Sample sizes (n) are noted in parentheses. Significant differences from wild type are represented by either a single asterisk (p < .05) or double asterisk (p < .01).
|
|
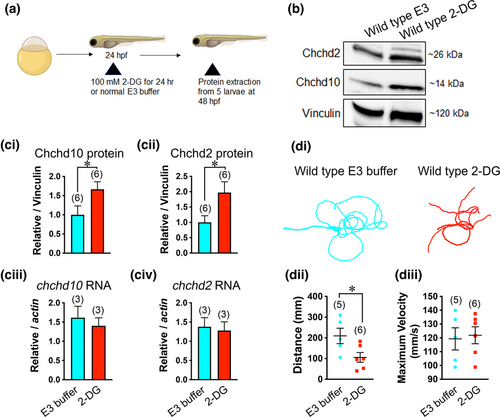
Both Chchd10 and Chchd2 proteins display elevated expression levels in response increased mitochondrial reliance in wild type larvae. (a) Experimental timeline for 2-DG treatment (images were created using BioRender). (b) Example immunoblot showing Chchd10 and Chchd2 expression change following treatment with to 2-DG. (ci, ii) Quantification of immunoblot data. Significant difference in both Chchd10 (t-test, p = .05), and Chchd2 (t-test, p = .04) protein levels following 2-DG treatment was observed. Vinculin was used as loading control. (ciii, iv) Unchanged expression levels following 2-DG exposure in both transcripts: chchd10 (t-test, p = .59, relative to actin) and chchd2: (t-test, p = .78, relative to actin). (di) Representative touch-evoked larval motor responses following exposure to 2-DG or E3 buffer treatment for 24 h. Motor responses were evaluated at 56 hpf. (dii) Larvae exposed to 2-DG show significantly reduced swim distance (t-test, p = .04), though maximum swim velocity. Part (diii) was not found to be significantly different (t-test, p = .80). Sample sizes (n) are noted in parentheses. Single asterisks represent significant differences from E3-treated wild type larvae (p < .05).
|
|
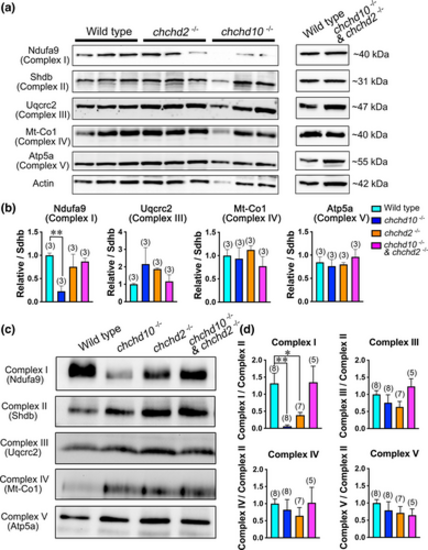
Reduced assembly of mitochondrial Complex I in chchd10?/? and chchd2?/? zebrafish larvae, but not in double chchd10?/? and chchd2?/? larvae at 5 dpf. (a) Immunoblot analysis of mitochondrial respiratory chain subunits in larvae aged 5 dpf and quantification (b). Ndufa9 is significantly reduced in chchd10?/? larvae (p = .003). Data is represented as mean ± SEM. Sample sizes (n) are noted in parentheses. (c) Representative blue native PAGE with each lane constituted of an individual 5 dpf larvae of respective genotype and quantification (d). Significant reduction of Complex I assembly was observed in chchd10?/? larvae (p = .003), and chchd2?/? larvae (p = .044), but not in double chchd10?/? and chchd2?/? model (p = .990). Significance was assessed using a one-way ANOVA and Tuckey's multiple comparison test, and significant differences from wild type larvae are represented by either a single asterisk (p < .05) or double asterisk (p < .01). Data is represented as mean ± SEM. Sample sizes (n) are noted in parentheses.
|
|
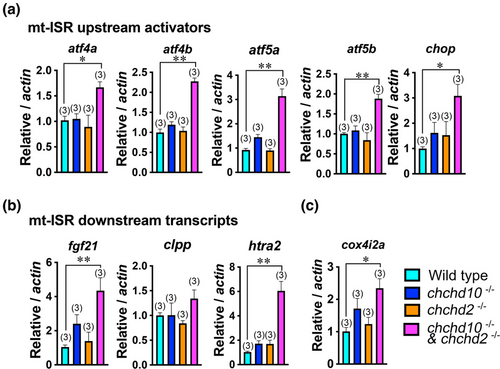
Several markers of the mitochondrial stress response are upregulated in our double chchd10?/? and chchd2?/? model at 5 dpf. (a) All mitochondrial integrated stress response (mt-ISR) upstream activators were significantly increased in the double chchd10?/? and chchd2?/? model including atf4a (p = .019); atf4b (p = .01); atf5a (p = .0001); atf5b (p = .0014); chop (p = .0029). (b) Several downstream targets are upregulated in the double chchd10?/? and chchd2?/? model including htra2 (p = .0002); fgf21 (p = .0062), but not clpp (p = .1799). (c) Oxygen responsive transcript cox4i2a was significantly increased in our double chchd10?/? and chchd2?/? model (p = .017). Data is represented as mean ± SEM. Sample sizes (n) are noted in parentheses. Significant differences from wild type larvae are represented by either a single asterisk (p < .05) or double asterisk (p < .01) using a one-way ANOVA followed by a Tuckey's multiple comparison test.
|

