Image
Figure Caption
Fig. 6
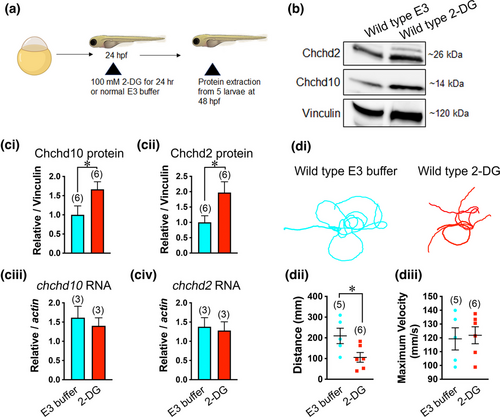
Both Chchd10 and Chchd2 proteins display elevated expression levels in response increased mitochondrial reliance in wild type larvae. (a) Experimental timeline for 2-DG treatment (images were created using BioRender). (b) Example immunoblot showing Chchd10 and Chchd2 expression change following treatment with to 2-DG. (ci, ii) Quantification of immunoblot data. Significant difference in both Chchd10 (t-test, p = .05), and Chchd2 (t-test, p = .04) protein levels following 2-DG treatment was observed. Vinculin was used as loading control. (ciii, iv) Unchanged expression levels following 2-DG exposure in both transcripts: chchd10 (t-test, p = .59, relative to actin) and chchd2: (t-test, p = .78, relative to actin). (di) Representative touch-evoked larval motor responses following exposure to 2-DG or E3 buffer treatment for 24 h. Motor responses were evaluated at 56 hpf. (dii) Larvae exposed to 2-DG show significantly reduced swim distance (t-test, p = .04), though maximum swim velocity. Part (diii) was not found to be significantly different (t-test, p = .80). Sample sizes (n) are noted in parentheses. Single asterisks represent significant differences from E3-treated wild type larvae (p < .05).
Acknowledgments
This image is the copyrighted work of the attributed author or publisher, and
ZFIN has permission only to display this image to its users.
Additional permissions should be obtained from the applicable author or publisher of the image.
Full text @ Dev. Neurobiol.

