FIGURE
Fig. 5
- ID
- ZDB-FIG-230816-11
- Publication
- Légaré et al., 2023 - Loss of mitochondrial Chchd10 or Chchd2 in zebrafish leads to an ALS-like phenotype and Complex I deficiency independent of the mitochondrial integrated stress response
- Other Figures
- All Figure Page
- Back to All Figure Page
Fig. 5
|
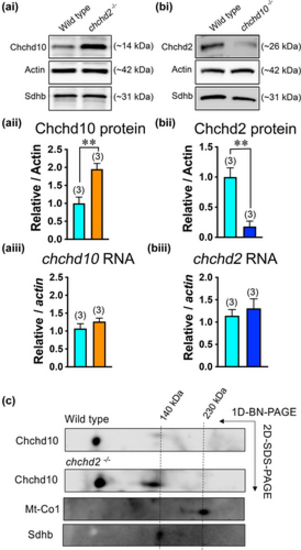
Larval Chchd10 compensates for loss of Chchd2 expression but not vice versa and is present in both a lower and higher molecular weight complex in zebrafish at 5 dpf. (ai) Representative immunoblot of Chchd10 protein level in chchd2?/? larvae aged 5 dpf. (aii) Immunoblot quantification (5 dpf) showing increased Chchd10 expression compared to wild type in chchd2?/? larvae (t-test, p = .011). Actin was used as loading control. (aiii) Unchanged transcript levels of chchd10 in 5 dpf chchd2?/? larvae (t-test, p = .30 relative to actin). (bi) Representative immunoblot of Chchd2 protein expression in chchd10?/? larvae aged 5 dpf. (bii) Immunoblot quantification (5 dpf) showing reduced Chchd2 expression levels in chchd10?/? larvae compared to wild type larvae (t-test, p = .001). Actin was used as loading control. (biii) Unchanged transcript levels of chchd2 in 5 dpf chchd10?/? larvae (t-test, p = .55, relative to actin). (c) Second dimensional PAGE analysis using a Chchd10 antibody revealed a high molecular weight complex, close to 140 kDa, in both wild type and chchd2?/? larvae. Mt-Co1 and Sdhb are used as molecular weight markers. Sample sizes (n) are noted in parentheses. Significant differences from wild type are represented by either a single asterisk (p < .05) or double asterisk (p < .01).
|
Expression Data
Expression Detail
Antibody Labeling
Phenotype Data
Phenotype Detail
Acknowledgments
This image is the copyrighted work of the attributed author or publisher, and
ZFIN has permission only to display this image to its users.
Additional permissions should be obtained from the applicable author or publisher of the image.
Full text @ Dev. Neurobiol.

