
- Title
-
Novel analytical tools reveal that local synchronization of cilia coincides with tissue-scale metachronal waves in zebrafish multiciliated epithelia
- Authors
- Ringers, C., Bialonski, S., Ege, M., Solovev, A., Hansen, J.N., Jeong, I., Friedrich, B.M., Jurisch-Yaksi, N.
- Source
- Full text @ Elife
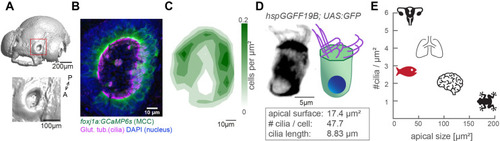
(A) Surface rendering of a 4-day-old zebrafish larva (top) and a zoom-in of the nasal cavity (bottom). (B) A representative example of a left nose marked by a red box in (A). In the maximum projection, motile cilia are labeled in magenta (glutamylated tubulin), nuclei in blue (DAPI), and multiciliated cells in green (foxj1a:GCaMP6s). Note the lack of multiciliated cells in the center of the nose. DAPI signals highlight the presence of other cell types. (C) A contour plot showing the average multiciliated cell density (maximum projection) with a total number of 50.8 multiciliated cells per fish (�6.2 SD; n=15). (D) A representative example (left) and schematic (right) of a multiciliated cell labelled in the transgenic line hspGGFF19B:UAS:GFP. On average, each cell has 47.7 cilia (�9.9 SD; n=4), the apical surface spans 17.4 �m2 (�6.3 SD; n=11), and cilia are 8.83 �m long (�0.86 SD; n=38; Figure 1?figure supplement 1B-E'). (E) A graph depicting ciliary density per cell across animals and organs. Shown are the zebrafish nose, clawed frog skin (Klos Dehring et al., 2013; Kulkarni et al., 2021), mouse brain ventricles (Redmond et al., 2019), lungs (Nanjundappa et al., 2019), and oviduct (Shi et al., 2014). All n refer to the number of fish. SD = standard deviation, A: anterior, P: posterior.
|

(A) Schematic spectral analysis of a reference pixel. As cilia move through a pixel (black rectangle), the pixel intensity fluctuates. The Fourier transform of pixel intensity time series (top), with peak frequency indicated (bottom). (B) Raw image frame of a representative light transmission recording in the left nose of a 4-day-old zebrafish larva overlaid with region representing cilia beating (white line). Example pixels used for panel D are shown with crosses. (C) Frequency map of nose pit depicting peak frequency for each pixel. Reference pixel used for panel D is shown with a black cross (D) Schematic depicting how the peak coherence measures ciliary synchronization. Note that unsynchronized pixels (blue) have low coherence throughout the frequency spectrum (left), while synchronized pixels (red) have a high coherence at the ciliary beating frequency (right). The location of the color-coded example pixels is shown on panel B (black: reference, blue: not synchronized, red: synchronized). (E) Peak coherence for three reference pixels (indicated with black crosses) with all other pixels in a recording. (F) Spectral power evaluated at the frequency of the reference pixels (f=25.9 Hz; 24.5 Hz; 25.2 Hz) (G) Relationship between coherence and spectral power for a representative example (using Pixel 1 from panel E as reference pixel). Three regions of interest are identified: synchronized pixels with high coherence and high spectral power at the frequency of Pixel 1 (red, coherence ?0.5 and spectral power ?10%), non-synchronized pixels with high spectral power at the frequency of Pixel 1 but low coherence (blue, coherence ?0.3and spectral power ?25%), and non-synchronized pixels with low spectral power at the frequency of Pixel 1 and low coherence (green, coherence ?0.5 and spectral power ?25%). Note that very few pixels show low spectral power but high coherence. (G?) Spatial position of the pixels classified in (G): Note that synchronized (red) and non-synchronized (blue) pixels do not spatially overlap. Same color scheme in G and G?. (H) Analogous to (G), but now as average across 6 fish represented as a probability density (using 6 reference pixels per fish). (I) The relationship between coherence and pixel distance plotted as probability density for an average of 6 fish. Note that pixels located within 20 �m tend to be more coherent.
|
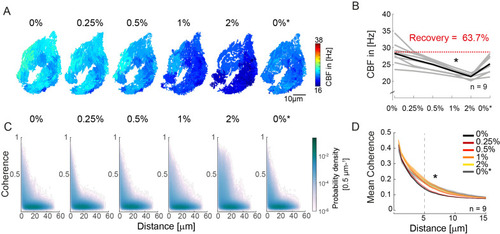
(A?B) Ciliary beating frequency decreases under increasing viscosity conditions (0?2% methylcellulose) and partially recovers upon re-exposure to 0% methylcellulose (0%*). (A) Representative example of ciliary beat frequency (CBF) maps of a 4-day-old zebrafish nose. (B) CBF for n=9 (gray) and average in black. A repeated measures ANOVA (*) indicates a significant effect of viscosity conditions on CBF (p = 0.003; n = 9). (C?D) Ciliary coherence extends with increased fluid viscosity. (C) A representative example of pairwise coherence versus distance for different viscosity conditions (Coherence bin width = 0.04/bin; distance bin width = 0.5 �m/bin). (D) Mean coherence across distance bins (width = 0.5 �m) for different viscosity conditions shows that coherence domains expand for conditions of increased viscosity. Mean curves and standard error of the mean are plotted (n=9). ANOVA-N indicates a significant effect of viscosity conditions on mean coherence across distances (p=3?10-5). CBF = Ciliary Beat Frequency.
|
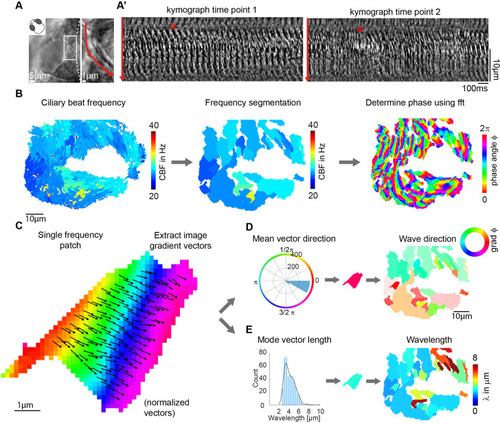
(A-A?) Metachronal coordination observed using a conventional kymograph-based analysis. (A) A kymograph was drawn (red line in inset, representing transverse cilia beating) on a light transmission recording of a zebrafish nose at 4dpf. (A?) Kymographs of cilia beating in the same location at different time points. Note the orderly pattern in the left panel (#) versus the disorderly pattern in the right panel (*). (B?D) Pipeline to measure metachronal coordination based on a phase angle method. (B) Neighboring pixels with similar frequency (beat frequency map, left) are segmented into patches (center). Phase angles are determined from Fourier transforms evaluated at the prominent frequency of each segmented frequency patch (right). (C) Analysis proceeds for each patch by extracting an image gradient, as shown by the arrows. (D?E) The mean direction of the gradient vector characterizes wave direction ? with transparency representing the inverse circular standard deviation (D, right) while its length determines the wavelength (E, left). Scale bars, 10 �m. See also Videos 1?3.
|
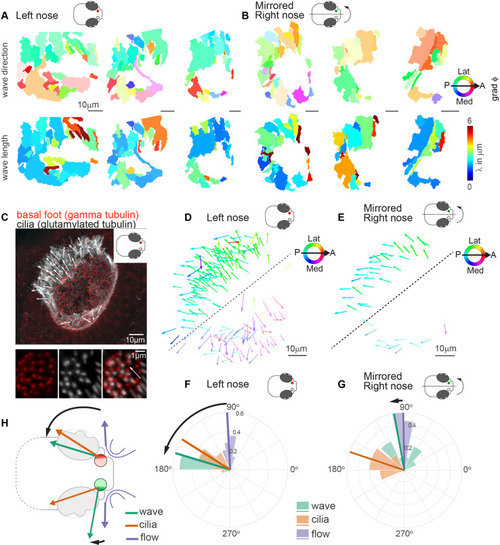
(A?B) Wave direction (top) and wavelength (bottom) for three left (A, red) and three mirrored right (B, green) noses show asymmetry in the wave direction between the left and right noses. Transparency reflects the inverse circular standard deviation. (C) Immunohistochemistry on a left nose stained for gamma-tubulin (basal body marker, red) and glutamylated tubulin (cilia marker, white). Zoom-in obtained at higher magnification displays how gamma-tubulin and glutamylated-tubulin stains are offset, allowing to determine cilia foot orientation and thus ciliary beat direction. (D?E) Overlay of all ciliary beat directions in the left (D; n=10) and mirrored right (E; n=3) noses. Individual arrows refer to the polarity of individual cells across fish. Direction is color-coded. Note a clear distinction in polarity between the latero-posterior and medial part of the nose indicated by a dashed line. (F?G) Quantification of ciliary beat directions, metachronal wave (left, n=16; right, n=18) and overall fluid flow directions for left (F; n=14) and mirrored right (G; n=14) noses. Plotted are the mean directions per fish for the latero-posterior part of the noses (above dashed line in D and E). Note that a direct comparison of ciliary beating direction and wave direction in the same experiments was not possible due to different positioning of the zebrafish for both experiments. (H) Schematic of the ciliary beating, metachronal wave and fluid flow directions in the left versus the right noses. Note the offset between the fluid flow (blue) and metachronal waves directions (green) for the left and right noses. Scale bars 10 �m.
|
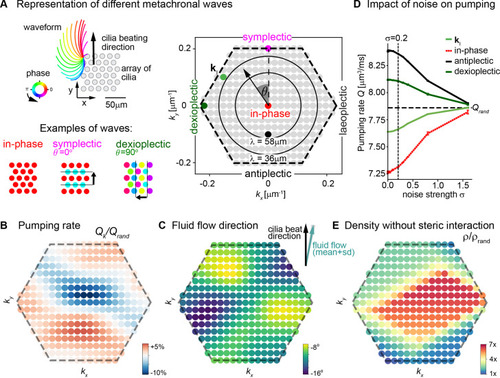
(A) Possible traveling wave solutions in a computational model of a cilia carpet. Left: Cilia are arranged on a triangular lattice (gray dots), with three-dimensional cilia beat pattern from Paramecium (not to scale, cilia length 10 ?m). Three example wave solutions are highlighted: in-phase beating, symplectic wave, dexioplectic wave. Wave fronts are indicated by black lines and the wave direction by an arrow, while the color code of cilia base points represents cilia phase. Right: Visualization of the set of all possible wave solutions as function of wave vector k=(kx,ky), where the distance from the origin encodes the wavelength of the wave as ? = 2? / |k| and the directional angle ? encodes the direction of the wave relative to the direction of the effective stroke of the cilia beat. Example waves from left panel are highlighted as colored dots. (B) Pumping rate Q per cilium computed for different wave solutions, with each wave represented by a color-coded dot as in hexagon plot of panel A (normalized by pumping rate Qrand ? 7.87 ?m3/ms for cilia beating with random phase relationship). (C) Direction of cilia-generated flow (averaged over one beat cycle) for different wave solutions relative to the direction of the effective stroke of the cilia beat; note that the range of the color bar spans only 10?. Mean � standard deviation is shown in the upper right corner. (D) Pumping rate per cilium for four selected wave solutions as indicated in hexagon plot of panel (A) as function of a noise strength ? (see text for details). Dashed line indicates mean pumping rate for cilia beating with random phase relationship (Qrand). (E) Critical density ? of a cilia carpet below which steric interactions between cilia arise for different wave solutions; density ? is normalized relative to a critical density for cilia beating with random phase relationship, ?rand = 0.015 ?m?2.
|