
|
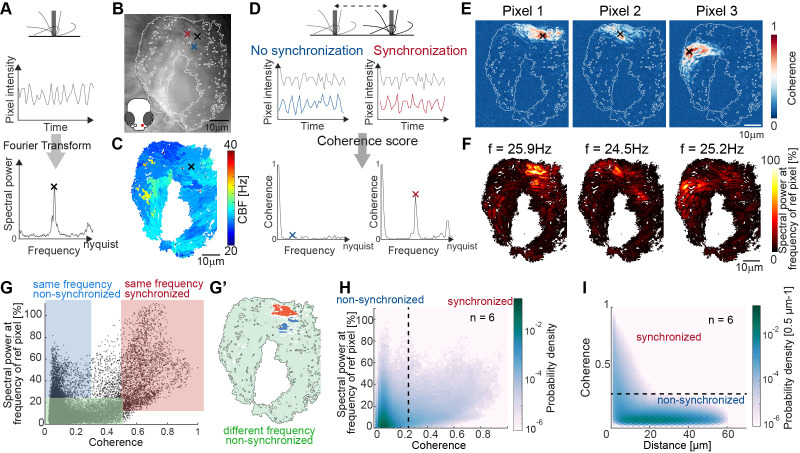
Figure 2
(A) Schematic spectral analysis of a reference pixel. As cilia move through a pixel (black rectangle), the pixel intensity fluctuates. The Fourier transform of pixel intensity time series (top), with peak frequency indicated (bottom). (B) Raw image frame of a representative light transmission recording in the left nose of a 4-day-old zebrafish larva overlaid with region representing cilia beating (white line). Example pixels used for panel D are shown with crosses. (C) Frequency map of nose pit depicting peak frequency for each pixel. Reference pixel used for panel D is shown with a black cross (D) Schematic depicting how the peak coherence measures ciliary synchronization. Note that unsynchronized pixels (blue) have low coherence throughout the frequency spectrum (left), while synchronized pixels (red) have a high coherence at the ciliary beating frequency (right). The location of the color-coded example pixels is shown on panel B (black: reference, blue: not synchronized, red: synchronized). (E) Peak coherence for three reference pixels (indicated with black crosses) with all other pixels in a recording. (F) Spectral power evaluated at the frequency of the reference pixels (f=25.9 Hz; 24.5 Hz; 25.2 Hz) (G) Relationship between coherence and spectral power for a representative example (using Pixel 1 from panel E as reference pixel). Three regions of interest are identified: synchronized pixels with high coherence and high spectral power at the frequency of Pixel 1 (red, coherence ?0.5 and spectral power ?10%), non-synchronized pixels with high spectral power at the frequency of Pixel 1 but low coherence (blue, coherence ?0.3and spectral power ?25%), and non-synchronized pixels with low spectral power at the frequency of Pixel 1 and low coherence (green, coherence ?0.5 and spectral power ?25%). Note that very few pixels show low spectral power but high coherence. (G?) Spatial position of the pixels classified in (G): Note that synchronized (red) and non-synchronized (blue) pixels do not spatially overlap. Same color scheme in G and G?. (H) Analogous to (G), but now as average across 6 fish represented as a probability density (using 6 reference pixels per fish). (I) The relationship between coherence and pixel distance plotted as probability density for an average of 6 fish. Note that pixels located within 20 �m tend to be more coherent.
Spectral analysis of cilia beating reveals local coherence but global heterogeneity.