
Figure 1
- ID
- ZDB-FIG-230221-17
- Publication
- Ringers et al., 2023 - Novel analytical tools reveal that local synchronization of cilia coincides with tissue-scale metachronal waves in zebrafish multiciliated epithelia
- Other Figures
- All Figure Page
- Back to All Figure Page
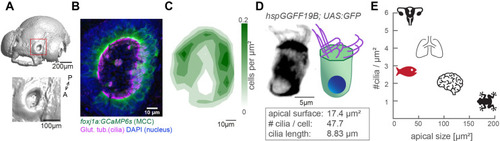
(A) Surface rendering of a 4-day-old zebrafish larva (top) and a zoom-in of the nasal cavity (bottom). (B) A representative example of a left nose marked by a red box in (A). In the maximum projection, motile cilia are labeled in magenta (glutamylated tubulin), nuclei in blue (DAPI), and multiciliated cells in green (foxj1a:GCaMP6s). Note the lack of multiciliated cells in the center of the nose. DAPI signals highlight the presence of other cell types. (C) A contour plot showing the average multiciliated cell density (maximum projection) with a total number of 50.8 multiciliated cells per fish (�6.2 SD; n=15). (D) A representative example (left) and schematic (right) of a multiciliated cell labelled in the transgenic line hspGGFF19B:UAS:GFP. On average, each cell has 47.7 cilia (�9.9 SD; n=4), the apical surface spans 17.4 �m2 (�6.3 SD; n=11), and cilia are 8.83 �m long (�0.86 SD; n=38; Figure 1?figure supplement 1B-E'). (E) A graph depicting ciliary density per cell across animals and organs. Shown are the zebrafish nose, clawed frog skin (Klos Dehring et al., 2013; Kulkarni et al., 2021), mouse brain ventricles (Redmond et al., 2019), lungs (Nanjundappa et al., 2019), and oviduct (Shi et al., 2014). All n refer to the number of fish. SD = standard deviation, A: anterior, P: posterior.
|