
Figure 4
- ID
- ZDB-FIG-230221-25
- Publication
- Ringers et al., 2023 - Novel analytical tools reveal that local synchronization of cilia coincides with tissue-scale metachronal waves in zebrafish multiciliated epithelia
- Other Figures
- All Figure Page
- Back to All Figure Page
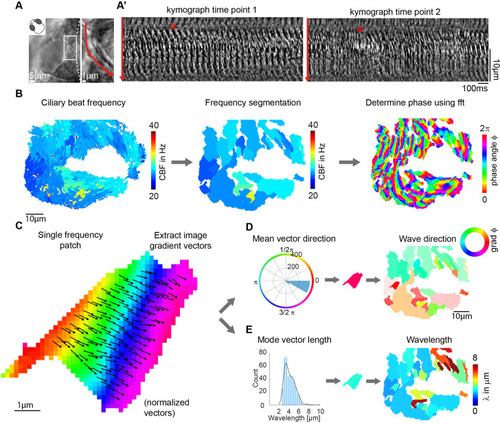
(A-A?) Metachronal coordination observed using a conventional kymograph-based analysis. (A) A kymograph was drawn (red line in inset, representing transverse cilia beating) on a light transmission recording of a zebrafish nose at 4dpf. (A?) Kymographs of cilia beating in the same location at different time points. Note the orderly pattern in the left panel (#) versus the disorderly pattern in the right panel (*). (B?D) Pipeline to measure metachronal coordination based on a phase angle method. (B) Neighboring pixels with similar frequency (beat frequency map, left) are segmented into patches (center). Phase angles are determined from Fourier transforms evaluated at the prominent frequency of each segmented frequency patch (right). (C) Analysis proceeds for each patch by extracting an image gradient, as shown by the arrows. (D?E) The mean direction of the gradient vector characterizes wave direction ? with transparency representing the inverse circular standard deviation (D, right) while its length determines the wavelength (E, left). Scale bars, 10 �m. See also Videos 1?3.
|