FIGURE SUMMARY
Title

A model for reticular dysgenesis shows impaired sensory organ development and hair cell regeneration linked to cellular stress

Authors
Rissone, A., Jimenez, E., Bishop, K., Carrington, B., Slevin, C., Wincovitch, S.M., Sood, R., Candotti, F., Burgess, S.M.
Source
Full text @ Dis. Model. Mech.

ak2 larval expression in the otic vesicle and sensory phenotypes of the zebrafish ak2 alleles. (A) WISH on wild-type zebrafish larvae at different developmental stages. Lateral (3-5 dpf) and dorsal (5 dpf) views. Black arrows point to ak2 expression in the otic vesicles. Scale bars: 200 μm. (B) Survival rates for wild-type, ak2 heterozygous, and ak2 mutant larvae at different dpf. Top and bottom graphs show survival of the progeny from an incross of ak2hg16/+ or ak2hg14/+ heterozygous animals, respectively. Dashed lines indicate the expected ratio following Mendelian inheritance. Numbers above the bars indicate the total number of embryos used for genotyping analysis at each stage. (C,D) Comparison of confocal maximum projections of inner ear regions (dashed circles) from Tg(pou4f3:GAP-GFP) wild type (WT) and ak2hg14 mutants at 3 (C) and 4 (D) dpf. Scale bars: 20 µm. For each set of images, graphs show the comparison of the average number of GFP+ hair cells in the anterior macula (3 dpf) and cristae (3 and 4 dpf) between ak2-deficient animals and controls (WT). a, anterior; ac, anterior crista; am, anterior macula; HCs, hair cells; m, medial; mc, medial crista; NM, neuromast; p, posterior; pc, posterior crista. The error bars indicate s.d. ****P<0.0001 (two-tailed unpaired Student's test).

Reduced hair cell number and secondary neuromast differentiation phenotypes in ak2hg14 mutants. (A) Alkaline phosphatase staining of 3-5 dpf ak2hg14 homozygous embryos and their siblings (WT). White arrowheads indicate the migrating secondary primordium (primII). L1-2 and LII.1-3 designate primary and secondary neuromasts, respectively. Scale bars: 50 μm. (B,C) Yo-PRO-1 iodide staining of hair cells (HCs) in lateral line neuromasts in ak2hg14 embryos and their wild-type siblings during development to compare the average number of HCs in LII.1 secondary neuromasts (B) and in primary neuromasts (C). (D) Average number of HCs per primary neuromast in Yo-PRO-1 iodide-stained ak2hg14 embryos and their siblings 2 days after ablation with CuSO4. Mean±s.d.**P<0.0011; ****P<0.0001 (unpaired, two-tailed Student's t-test).

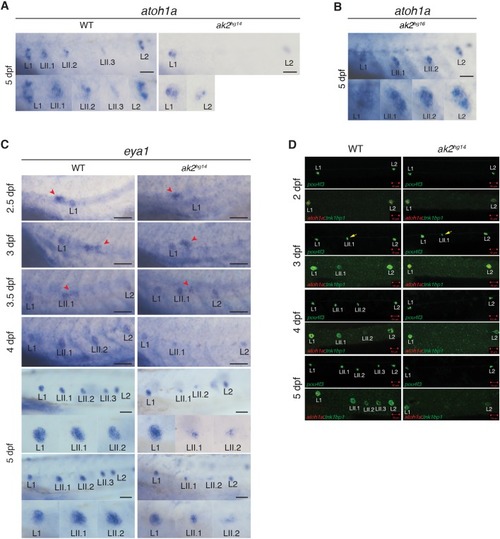
Characterization of PLL neuromast markers in lateral line of ak2hg14 mutants. (A,B) WISH analysis of atoh1a marker expression in primary and secondary neuromasts on 5 dpf ak2hg14 (A) and ak2hg16 (B) embryos and their siblings (WT). (C) eya1 expression from 2.5 to 5 dpf in ak2hg14 embryos and their siblings. Red arrowheads indicate the primII. Each panel shows higher magnification of the regions in dashed rectangles from corresponding pictures in Fig. S5. Scale bars: 100 µm. (D) Confocal analysis from 2 to 5 dpf of trunk regions of ak2hg14 embryos and their siblings with different transgenic backgrounds to visualize components of the lateral line rosettes. Scale bars: 50 µm. Yellow arrows indicate pou4f3:GFP+ HCs in secondary neuromasts.

Analysis of lateral line phenotypes using different ak2 mutant transgenic lines. (A) Confocal analysis at different developmental stages of the trunk regions of ak2hg15 embryos and their control siblings (WT) in the Tg(-8.0cldnb:LY-EGFP) background. (B) Confocal analysis from 3.5 to 4 dpf of trunk regions of an ak2hg15 embryo and a control embryo in the Tg(-8.0cldnb:LY-EGFP) background labeling the migrating secondary primordium (dashed ellipse), deposited secondary neuromast (red circle), connecting interneuromast cells and epithelial cells. Confocal images were collected before and right after the end of the time-lapse confocal movie recording. (C) Confocal analysis from 3 to 5 dpf of trunk regions of ak2hg14 embryos and their siblings in different lateral line transgenic backgrounds. Yellow asterisks label the interneuromast cells between L1 and L2 in the sqet20Et transgenic line. White and yellow arrowheads denote primI or primII interneuromast cells, respectively. White asterisks label the migrating secondary primordium. Scale bars: 50 µm.

ak2 deficiency impairs IC neuromast formation. (A,B) Chemical treatments of ak2hg14 mutants and their control siblings (WT) with AG1478 or 6-BIO. (A) Confocal analysis at 5 dpf of trunk regions for untreated, 0.03% DMSO or 3 µM AG1478-treated embryos in the Tg(tnks1bp1:EGFP; atoh1a:dTOM) transgenic background. Scale bars: 50 µm. (B) Alkaline phosphatase staining of 5 dpf ak2hg14 and control embryos untreated or treated with 0.02% DMSO, 2 µM AG1478 or 0.2 µM 6-BIO compounds. White asterisks indicate IC neuromasts. Scale bars: 50 μm. (C) Quantification of the effect of AG1478 or 6-BIO treatments in inducing the formation of ectopic ICs in ak2hg14 homozygous mutants and their control siblings. The total number of embryos analyzed per genotype is indicated above each bar.

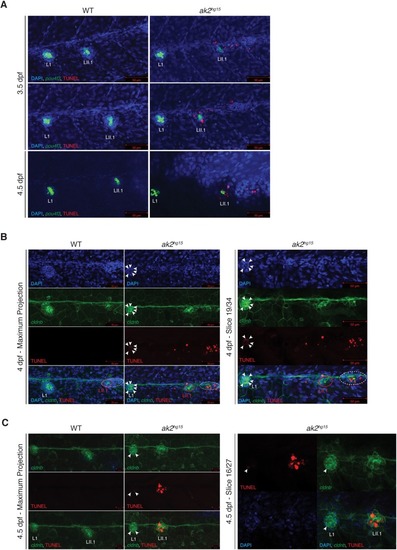
Increased cell death in the otic vesicles and the PLL of ak2hg15 embryos. (A) Maximum projections of 3.5 and 4.5 dpf ak2hg15 embryos and their control siblings in the Tg(pou4f3:GAP-GFP) background (indicated as pou4f3) stained with TUNEL assays (red signal). (B,C) Maximum projections (left panels) and representative single plane confocal analysis (right panels) at 4 (B) and 4.5 (C) dpf of a TUNEL assay (red signal) performed on ak2hg15 embryos and their siblings in the Tg(-8.0cldnb:LY-EGFP) background (cldnb, green) labeling the migrating secondary primordium (dashed ellipse), deposited primary and secondary (red circle) neuromasts and epithelial cells. White arrowheads label TUNEL-positive cells in the L1 primary neuromast. Nuclei are labeled with DAPI (blue). Scale bars: 50 µm (A,B); 20 µm (C).

Altered expression of oxidative stress markers in ak2hg14 embryos. Expression analysis of oxidative stress markers in ak2hg14 and control sibling (WT) embryos at 4 or 5 dpf. (A) Upregulated expression of several prdx genes in the otic vesicle and PLL at 4 dpf. Bottom panel for prdx1 marker: the black arrows indicate ectopic expression of the marker in PLL neuromasts of the corresponding embryos. (B) Downregulated expression of gpx4a and gpx4b markers at 4 dpf. (C) Specific downregulation of prdx2 marker at 5 dpf in PLL neuromasts and caudal hematopoietic tissue (red arrowhead, CHT). Scale bars: 200 µm. (D) Comparison of gstp1 expression in the PLL neuromasts in control embryos, ak2hg14 null and ak2hg16 hypomorphic mutants at 4 dpf. Two different embryos per genotype are shown. Lateral views with anterior to the left. Black arrowheads indicate the otic vesicle. Scale bars: 100 µm.

Antioxidant treatment partially rescues hair cell numbers in the inner ear and the lateral line of ak2hg14 mutants. (A,B) Average number of mature hair cells in the inner ear cristae (top) and anterior macula (bottom) of 3 dpf (A) or in the inner ear cristae of 4 dpf (B) ak2hg14 embryos treated with different concentrations of GSH (100-300 µM). Results are shown as mean±s.e.m. (one-way ANOVA, followed by Tukey's post hoc test; P<0.001). (C) Summary of the percentage of rescue induced by the different GSH treatments on the inner ear cristae and anterior macula at 3 and 4 dpf. (D) Quantitative analysis of the rescue induced by GSH treatments on the expression of alkaline phosphatase in PLL neuromasts of 4 and 5 dpf ak2hg14 and control embryos. Numbers above bars indicate the total amount of embryos used for the analysis. a, anterior; m, medial; p, posterior; UNTR, untreated. A one-way ANOVA (followed by Tukey's post hoc test; P<0.001) was used to compare groups of fish treated differently.

Acknowledgments
This image is the copyrighted work of the attributed author or publisher, and ZFIN has permission only to display this image to its users. Additional permissions should be obtained from the applicable author or publisher of the image. Full text @ Dis. Model. Mech.