- Title
-
A thrombomodulin-like gene is crucial to the collective migration of epibolic blastomeres during germ layer formation and organogenesis in zebrafish
- Authors
- Lee, G.H., Chang, C.L., Chiu, W.T., Hsiao, T.H., Chen, P.Y., Wang, K.C., Kuo, C.H., Chen, B.H., Shi, G.Y., Wu, H.L., Fu, T.F.
- Source
- Full text @ J. Biomed. Sci.
|
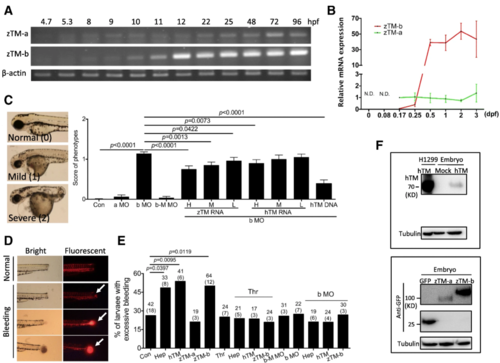
Zebrafish TM-b is functionally comparable to human thrombomodulin. Stage-dependent expression of zebrafish TM-like transcripts was examined by RT-PCR ( a) and real-time PCR ( b) with the cDNA prepared from the embryos of indicated stages. The relative mRNA expression levels were normalized with the mRNA levels of zebrafish ?-actin and zTM-a at 0.17 dpf embryos by using 2-??Ct method. c Zebrafish embryos were injected with MO specific to zebrafish TM-a (a MO, 0.92?pmol/embryo) or TM-b (b MO, 0.46?pmol/embryo) with/without co-injecting the plasmids expressing recombinant human TM (100?pg/embryo) or cRNA of zebrafish TM-b or human TM (H: 2130.8?pg/embryo; M: 1733.1?pg/embryo; L: 1155.4?pg/embryo) at 1 to 2-cell stages. Embryos injected with TM-b MO with five mismatched nucleotides (zTM-b mismatched MO) were used as the control for comparison. Larvae were examined at 3 dpf for survival and categorized into normal, mild and severe abnormal based on their gross morphology (left) and quantified (right). The categorization for mild and severe phenotypes was mainly based on the severity of heart edema and extent of trunk development: embryos displayed observable pericardial edema and body curvature were categorized as mild; whereas those displaying apparent pericardial edema and dorsalization were categorized as severe. d, e Control or experimental larvae at 3 dpf were injected with the indicated tested reagents with Texas red at common cardinal vein (CCV). Larvae were incubated at 28?°C for 30?min and amputated to remove tails before recording for their hemostatic activity. Larva displaying excessive blood leakage with more apparent diffusion of blood/Texas red from the wound, as compared with control larvae, was categorized as bleeding phenotype and recorded. The numbers on top of each column represent the total number of larvae tested (without parenthesis) in the total number of repeats (with parenthesis). f Embryos injected with plasmids encoding either human TM, zTM-a or zTM-b at 1 to 2-cell stages were harvested at 24 hpf and immunoblotting for the expression of recombinant TMs with anti-hTM antibodies (left) and anti-eGFP antibodies (right). The extracts of H1299 cells transfected with plasmids expressing human TM were served as a positive control. The tested reagents included: heparin (Hep; 57.5?ng/larva), thrombin (Thr; 23 ?U/larva), plasmids encoding zebrafish TM-a (zTM-a; peGFP N1-zTM-a, 200?pg/larva for hemostatic assay and 460?pg/larva for Western blotting), plasmids encoding zebrafish TM-b (zTM-b; peGFP N1-zTM-b, 200?pg/larva for hemostatic assay and 920?pg/larva for Western blotting), zTM-b MO (b MO), zTM-b mismatched MO (b-M MO), and plasmids encoding human TM (hTM; pcDNA3.1-hTM, 100?pg/larva for hemostatic assay and 800?pg/larva for Western blotting) EXPRESSION / LABELING:
PHENOTYPE:
|
|
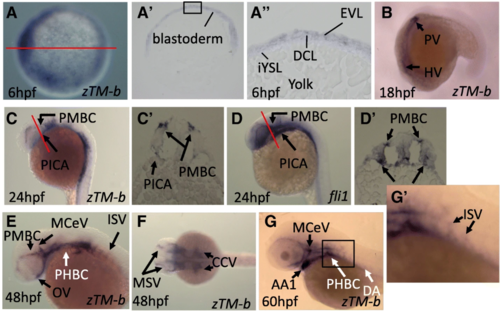
Spatiotemporal expression of zebrafish TM-b during early embryogenesis. Whole-mount in situ hybridization was performed using the embryos at the indicated stages with the riboprobes specific to zebrafish TM-b or endothelial marker for blood vessels ( fli1). Embryos were imaged either from the animal pole ( a), lateral view ( b~ e and g) or dorsal view ( f). (A~A??) The stained embryos were cross-sectioned sagittally (red line) and displayed in lateral view with animal pole to the top (A?). The higher magnitude of blastoderm in the squared area was also shown (A??). Embryos of 24 hpf probed for the distribution of zTM-b ( c) and fli1 ( d) were cross-sectioned along the plane indicated by red lines (C? and D?). (G and G?) The image of embryo at 60 hpf was enlarged to show the ISVs signal. EVL: Envelop layer; DCL: Deep cell layer; iYSL: internal Yolk syncytial layer; HV: Head vasculature; PV: Presumptive vasculature; HBV: Head blood vessel; ISV: Intersegmental vessel; DA: Dorsal aorta; PCV, Posterior cardinal vein; PMBC, Primordial midbrain channel; PICA, Primitive internal carotid artery; OV, Optic vein; PHBC, Primordial hind-brain channel; MCeV, Mid-cerebral vein; MSV, Mesencephalic vein; AA1, Mandibular aortic arch |
|
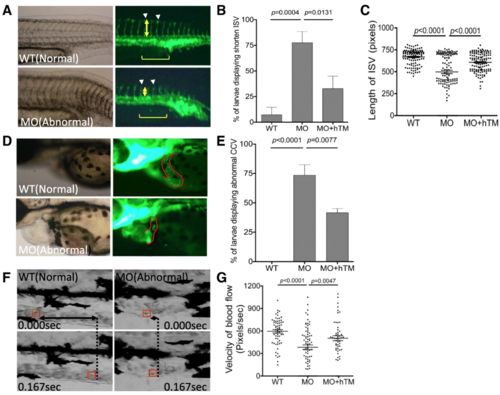
The impact of zTM-b knockdown to vessels formation. Tg ( fli 1:eGFP) embryos were injected with TM-b MO with/without co-injecting plasmids encoding human TM, as described in Material and Methods, and observed for the development of ISV at 28 hpf ( a- c) and CCV at 56 hpf ( d, e). The percentage of morphants displaying anomaly in ISV (arrowheads) and CCV (CCV boundary circled by solid line) were also recorded. The extent of incomplete extension observed in ISV was quantified by calculating the length (yellow double-headed arrows) of five ISV singlets (brackets) immediately adjacent to cloaca for each morphant. f, g Larvae at 3 dpf were video-recorded laterally for the trunk area with anterior to the right for blood flow. A single red blood cell (boxed in red) inside the caudal vein was traced and calculated for its traveling distance (F; double-headed arrows) and velocity ( g) by analyzing the serial video still frames within 0.167?s. Presented are the results collected from at least three independent experiments including total 16?35 larvae for each experimental group. WT, wild-type embryos; MO, zTM-b morphants; hTM, human thrombomodulin PHENOTYPE:
|
|
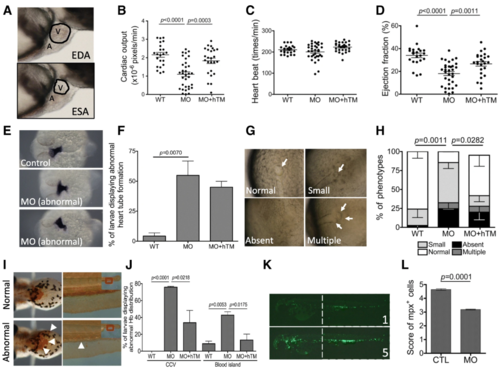
The impact of zTM-b knockdown in heart and blood cell formation. Wild-type and Tg ( mpx:eGFP) embryos were injected with TM-b MO with/without co-injecting plasmids encoding human TM and examined for the development of heart and blood cells. a- d The cardiac ejection fraction and cardiac output of larvae at 3 dpf were calculated from the change in the dimension of cardiac chamber (the circled area in ( a)) in the serial video still images (lateral view with anterior to the right) as described in Materials and Methods. e, f Embryos at 1 dpf were subjected to WISH for the distribution of cmlc2transcripts, a cardiac primordium marker. Embryos displaying signal with decreased intensity or spatially aberrant distribution (heart tube with mid-line positioning or right-jogging) were categorized as abnormal and quantified. g, h The development of embryonic right-left patterning was evaluated at 12 hpf and categorized into normal, small, absent and multiple based on the number and morphology of Kupffer?s vesicle (arrows). i, j Embryos at 3 dpf were stained with o?-dianisidine for hemoglobin distribution. Larvae displaying weaker, dispersed or ectopic signals in common cardinal veins (arrowheads in left panel) and/or absence of posterior blood island (arrowheads in the right panel) were categorized as abnormal and quantified. k, l Tg ( mpx:eGFP) embryos with/without TM-b knockdown were imaged at 2 dpf and scored from 1 to 5 points based on the intensity of green fluorescence, which represented the quantity of mpx-positive leukocytes (mainly neutrophils). Data were collected from at least 3 independent experiments with the total embryo numbers of 11?84 for each group. WT, un-injected wild-type embryos; MO, embryos injected with TM-b MO; hTM, human thrombomodulin; CTL, Tg ( mpx:eGFP) embryos without MO injection; A, atrium; V, ventricle; EDA, end-diastolic area; ESA, end-systolic area PHENOTYPE:
|
|
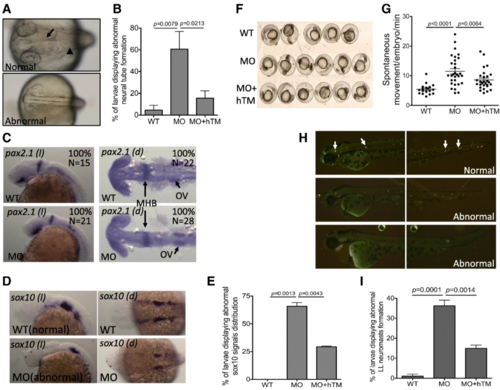
The impact of zTM-b knockdown in neural development. Wild-type embryos, subjected to with/without injecting TM-b MO and rescuing with hTM, were observed and collected at the indicated stages for evaluating the neural tissues development. a, b Embryos at 1 dpf were imaged dorsally under a light dissecting microscope. Those embryos displaying absence or aberrant formation of brain ventricle (arrow) and brain structure (such as mid-hind brain boundary indicated by arrowhead) were categorized as abnormal and quantified. c- e Embryos at 1 dpf were subjected to WISH for the distribution of pax2.1 (a marker of central nervous system) and sox10 (a marker of neural crest cells). Embryos were imaged both laterally ( l) and dorsally ( d) with anterior to the left. e Embryos displaying signal with altered intensity or distribution pattern for sox10, in comparison to wild-type, were categorized as abnormal and quantified. f, g Larval spontaneous movement was examined by video-recording the embryos at 1 dpf for 5?min and counting for the numbers of moving episode for each embryo. Presented here is a representative image of a series of video stills showing the arrangement of examined embryos. h, i The neuromasts of lateral line (arrows) in embryos of 2 dpf were visualized by staining with 4-Di-2-Asp and imaged laterally with anterior to the left. Those embryos displaying absent or aberrantly distributed neuromasts were categorized as abnormal and quantified. Data were collected from at least 3 independent experiments with the total sample numbers of 18?127 for each group in different experiments. WT, wild-type embryos; MO, zTM-b morphants; hTM, human thrombomodulin; OV, Otic vesicles |
|
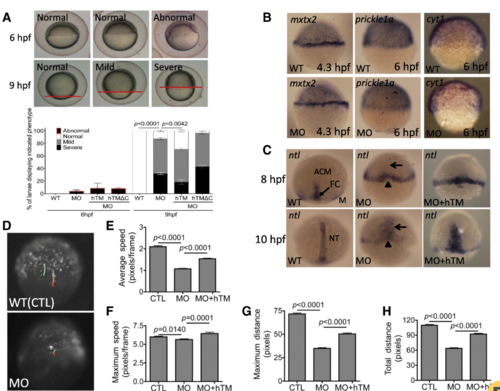
Knocking-down zTM-b impeded embryonic cells migration. Embryos of both wild-type and zTM-b morphants were monitored for epiboly progression during early embryogenesis. a The epibolic abnormality was categorized based on the extent of blastoderm movement. The progression of epiboly recorded at 6 hpf was categorized as abnormal when the extent of epiboly was less than 50%. The progression of epiboly recorded at 9 hpf was categorized as normal, mild delay (between 75 and 90% epiboly) and severe delay (less than 75% epiboly) based on the extent of epiboly (upper panel) and quantified (lower panel). The embryos were also co-injected with plasmids encoding human TM or human TM with truncated intracellular domain for rescue. The amino acid residues from 523?K to 557?L in human TM were removed in the hTM truncated construct TMdelC-pEGFP/N1. b The progression of epiboly in wild-type embryos and zTM-b morphants with/without hTM rescue were characterized by WISH with the riboprobes specific to margin and YSL ( mxtx2), marginal epiblasts ( prickle1a) and EVL ( cyt1) , respectively, at the indicated stages. c Convergent extension movements of epibolic blastomeres were examined by WISH with ntl-specific riboprobes. Lack of forerunner cells (FC) at 8 hpf and shortened and broadened notochord (NT) at 10 hpf were apparent in zTM-b morphants. d Both wild-type embryos and zTM-b morphants at 64-cell stage were injected with plasmids expressing eGFP (peGFP N1, 150?pg/embryo) into one single cell and continuously traced under a fluorescence dissecting microscope from 6 hpf to 7 hpf for the migration of the injected cells. The migratory parameters of the recorded cells, including average speed ( e), maximum speed ( f), maximum distance ( g) and total distance ( h), were calculated with the on-line software CellTracker on MATLAB R2015a system. Reported are the averages calculated from total of 11 cells selected from three different embryos for each group. All images were shown in lateral view with animal pole to the top. WT, un-injected wild-type embryos; MO, zTM-b morphants; hTM, human thrombomodulin; hTM?C, human thrombomodulin with truncated-intracellular domain |
|
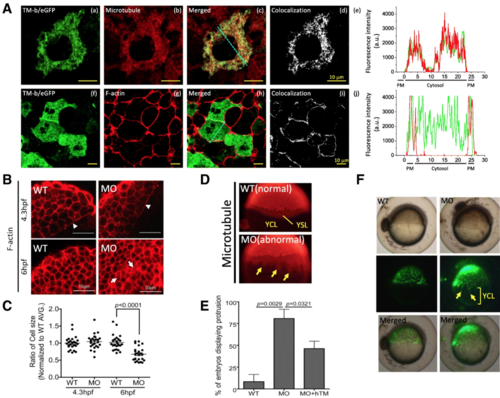
Cellular localization of zTM-b in developing embryos. a Wild-type embryos injected with plasmid zTM-b fused with eGFP (a, f; peGFP N1-zTM-b, 200?pg/embryo) at 1-cell stage were stained for microtubule (b) and F-actin (g) at 6 hpf with anti-?-tubulin antibodies and Alexa Flour 594 Phalloidin, respectively. (a-c, f-h) Confocal microscopy revealed distribution and colocalization of these proteins under excitation with a 488, or 543?nm laser. Blue dashed lines indicate the area of quantitative analyses of TM-b/microtubule/F-actin fluorescent intensity shown in (e) and (j). (d, i) Whole-cell pixel-by-pixel analyses of TM-b and microtubule or TM-b and F-actin colocalization. Scale bars, 10??m. (e, j) Quantitative fluorescent analyses of cellular TM-b/microtubule/F-actin distribution. PM: plasma membrane. b, c Cell size was estimated from the dimension of blastomeres in the confocal images of phalloidin 594-stained embryos ( b). Actin signal was detected in cell peripheral and actin ring at the front edge of epibolic blastoderm (arrowheads). Increased signal dispersed in cytoplasm was also observed (arrows). For calculating cell dimension, total of 25 cells selected from 5 images for each group were analyzed with the on-line software Image J. Reported are the relative cell size normalized with the averaged size of wild-type blastomeres of the same stages. d, e Wild-type embryos injected with TM-b MO, with/without hTM rescue, were immuno-stained with anti-?-tubulin antibodies at 4.3 hpf. Embryos displaying signal with spike-like protrusion into YCL (arrows) were observed in zTM-b knockdown group and quantified. f Embryos at 4 hpf were injected with SYTOX green (0.25?mM/2.3?nL/embryo), a vital dye specific for nucleus staining, at the junction of blastoderm and yolk. The injected embryos were observed continuously under a dissecting fluorescence microscope and imaged at 6 hpf. Some nucleuses (arrow) within YSL moved ahead of the margin of blastoderm in TM-b morphants. Images were taken from lateral view with the animal pole to the top. YCL, yolk cytoplasmic layer; YSL, yolk syncytial layer; WT, wild-type embryos; MO, zTM-b morphants; hTM, human thrombomodulin |
|
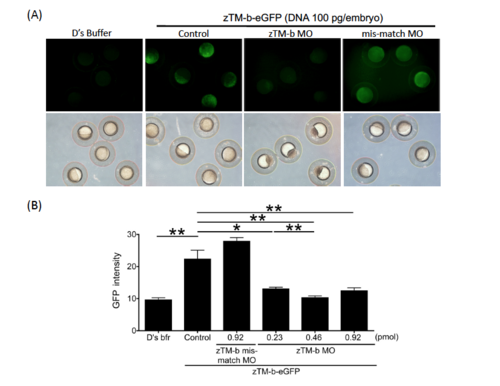
Efficiency of zTM-b MO. |
|
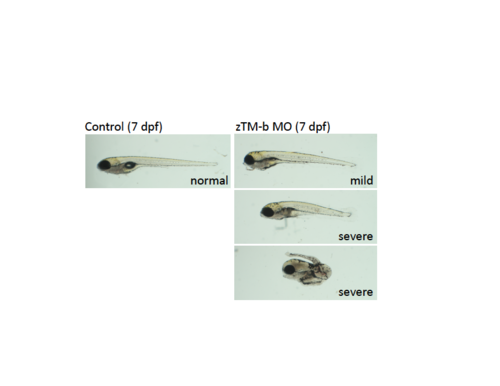
The zTM-b morphants did not recover from the developmental anomalies as the embryogenesis proceeding to the later stages. |

