Fig. 7
- ID
- ZDB-FIG-191021-18
- Publication
- Lee et al., 2019 - A thrombomodulin-like gene is crucial to the collective migration of epibolic blastomeres during germ layer formation and organogenesis in zebrafish
- Other Figures
- All Figure Page
- Back to All Figure Page
|
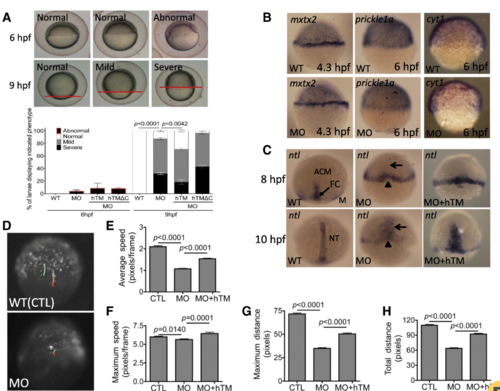
Knocking-down zTM-b impeded embryonic cells migration. Embryos of both wild-type and zTM-b morphants were monitored for epiboly progression during early embryogenesis. a The epibolic abnormality was categorized based on the extent of blastoderm movement. The progression of epiboly recorded at 6 hpf was categorized as abnormal when the extent of epiboly was less than 50%. The progression of epiboly recorded at 9 hpf was categorized as normal, mild delay (between 75 and 90% epiboly) and severe delay (less than 75% epiboly) based on the extent of epiboly (upper panel) and quantified (lower panel). The embryos were also co-injected with plasmids encoding human TM or human TM with truncated intracellular domain for rescue. The amino acid residues from 523?K to 557?L in human TM were removed in the hTM truncated construct TMdelC-pEGFP/N1. b The progression of epiboly in wild-type embryos and zTM-b morphants with/without hTM rescue were characterized by WISH with the riboprobes specific to margin and YSL ( mxtx2), marginal epiblasts ( prickle1a) and EVL ( cyt1) , respectively, at the indicated stages. c Convergent extension movements of epibolic blastomeres were examined by WISH with ntl-specific riboprobes. Lack of forerunner cells (FC) at 8 hpf and shortened and broadened notochord (NT) at 10 hpf were apparent in zTM-b morphants. d Both wild-type embryos and zTM-b morphants at 64-cell stage were injected with plasmids expressing eGFP (peGFP N1, 150?pg/embryo) into one single cell and continuously traced under a fluorescence dissecting microscope from 6 hpf to 7 hpf for the migration of the injected cells. The migratory parameters of the recorded cells, including average speed ( e), maximum speed ( f), maximum distance ( g) and total distance ( h), were calculated with the on-line software CellTracker on MATLAB R2015a system. Reported are the averages calculated from total of 11 cells selected from three different embryos for each group. All images were shown in lateral view with animal pole to the top. WT, un-injected wild-type embryos; MO, zTM-b morphants; hTM, human thrombomodulin; hTM?C, human thrombomodulin with truncated-intracellular domain |
| Fish: | |
|---|---|
| Knockdown Reagent: | |
| Observed In: | |
| Stage Range: | Shield to Bud |

