Fig. 3
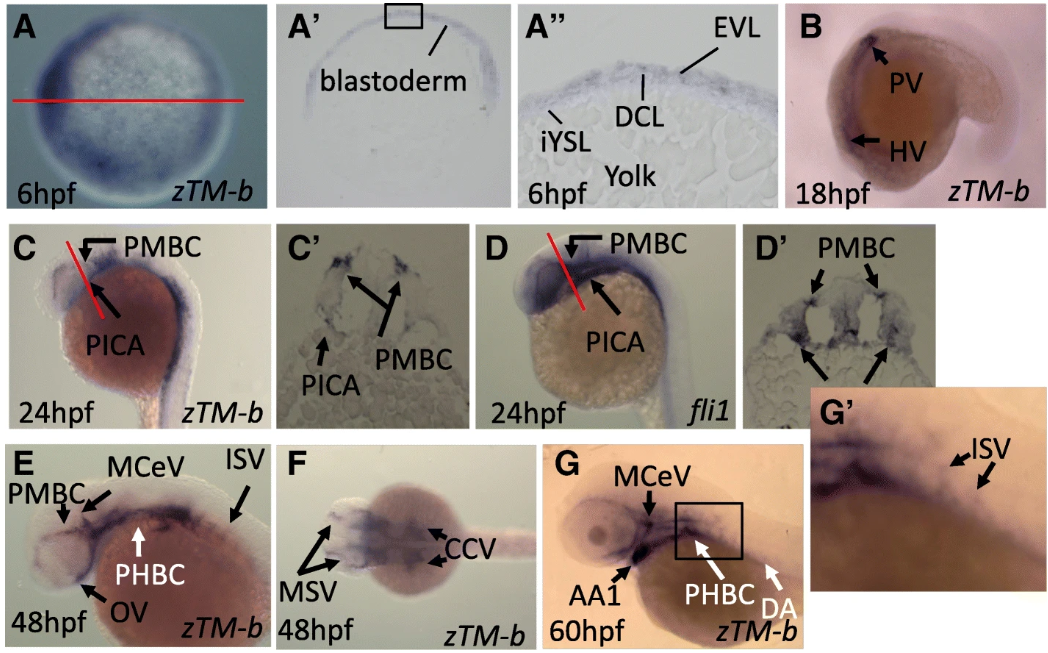
Spatiotemporal expression of zebrafish TM-b during early embryogenesis. Whole-mount in situ hybridization was performed using the embryos at the indicated stages with the riboprobes specific to zebrafish TM-b or endothelial marker for blood vessels ( fli1). Embryos were imaged either from the animal pole ( a), lateral view ( b~ e and g) or dorsal view ( f). (A~A??) The stained embryos were cross-sectioned sagittally (red line) and displayed in lateral view with animal pole to the top (A?). The higher magnitude of blastoderm in the squared area was also shown (A??). Embryos of 24 hpf probed for the distribution of zTM-b ( c) and fli1 ( d) were cross-sectioned along the plane indicated by red lines (C? and D?). (G and G?) The image of embryo at 60 hpf was enlarged to show the ISVs signal. EVL: Envelop layer; DCL: Deep cell layer; iYSL: internal Yolk syncytial layer; HV: Head vasculature; PV: Presumptive vasculature; HBV: Head blood vessel; ISV: Intersegmental vessel; DA: Dorsal aorta; PCV, Posterior cardinal vein; PMBC, Primordial midbrain channel; PICA, Primitive internal carotid artery; OV, Optic vein; PHBC, Primordial hind-brain channel; MCeV, Mid-cerebral vein; MSV, Mesencephalic vein; AA1, Mandibular aortic arch

