
- Title
-
Yap1 promotes sprouting and proliferation of lymphatic progenitors downstream of Vegfc in the zebrafish trunk
- Authors
- Grimm, L., Nakajima, H., Chaudhury, S., Bower, N.I., Okuda, K.S., Cox, A.G., Harvey, N.L., Koltowska, K., Mochizuki, N., Hogan, B.M.
- Source
- Full text @ Elife
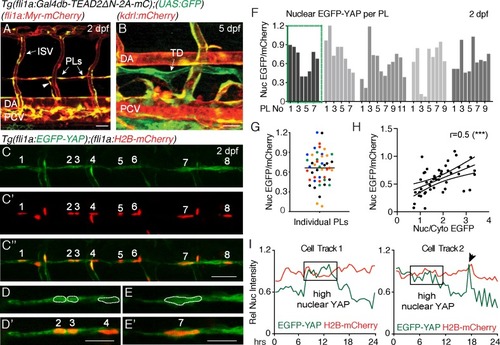
Nuclear EGFP-YAP changes dynamically in the developing trunk lymphatic vasculature.( A?B) The TEAD reporter line [ Tg(fli1:Gal4db-TEAD2?N-2A-mC);(UAS:GFP)] shows Yap1 activity in vasculature, parachordal LECs (PLs) and cardinal vein sprouts (arrowhead) of the 2 dpf trunk ( A) as well as in the thoracic duct (TD) at 5 dpf ( B). Scale bars: 40 ?m. ( C) Maximum projection of 8 PLs in a two dpf embryo showing EGFP-YAP in green [ Tg(fli1:EGFP-YAP)] and the nucleus in red ( C?), [ Tg(flil:H2B-mCherry)] and merge ( C??). Scale bar: 25 ?m. ( D?E) High power single z-sections of selected PLs from C, showing nuclear YAP in PL2 and PL3, but low nuclear YAP in PL4 ( D?D?) and PL7 ( E?E?). Scale bars: 10 ?m. ( F) Quantification of nuclear EGFP/mCherry average pixel intensity across individual PLs from multiple embryos at 2 dpf. Each bar represents a single PL (n = 47), each grey shade a different embryo (n = 5). PLs in ( C and D) highlighted in the green box. EGFP/mCherry Ratios have been calculated using mean fluorescent intensities in 3D. ( G) Scatter Plot of the Nuclear EGFP/mCherry average pixel intensity for individual PLs (n = 5 embryos). Each colour indicates PLs from a different embryo. Values calculated in 3D measurements of the mean fluorescent intensity for EGFP and mCherry (0.66 � 0.04, n = 47). ( H) Pearson Correlation Plot of the Nuclear EGFP/mCherry Ratio values in F and the Nuclear/Cytoplasmic EGFP Ratio values in Figure 1?figure supplement 1B (r = 0.52, 95% confidence intervals: 0.27 to 0.70, R square = 0.27, p=0.0002(***)). The two distinct approaches produce correlative measurements. ( I) Average nuclear pixel intensity graphs from cell tracks of single PLs time-lapse imaged from 2 to 3 dpf. EGFP-YAP intensity (green) is compared over time with H2B-mCherry (red) intensity in individual nuclei. Arrow points to a cell division during time-lapse. |

Yap1 acts cell autonomously to control trunk lymphangiogenesis in zebrafish.( A) Overall morphology of sibling (left) and MZ yap1ncv101-/- mutant (right) at 5 dpf. Arrowheads indicate mild craniofacial defects and absent swim bladder. Scale bar 200 ?m. ( B?C) Trunk vasculature of sibling and MZ yap1ncv101-/- mutant embryos at 5 dpf. Veins and lymphatics are displayed in white [ Tg(dab2b:EGFP)], erythrocytes show normal blood flow in red [ Tg(gata1:DsRed)]. Asterisks mark absent lymphatic vessels. ( C) Trunk vasculature of sibling and MZ yap1mw48-/- mutant at 6 dpf. Vascular nuclei are marked in green [ Tg(fli1a:nEGFP)], venous and lymphatic vessels in white [ Tg(?5.2lyve1b:DsRed)]. Asterisks indicate absent lymphatic vessels. Scale bars: 50 ?m in B and C. ( D) Percentage of TD fragments formed per somite, scored across six somites in total for siblings and MZ yap1ncv101-/-mutants at 5 dpf (sibling: 100% � 0, n = 23; MZ yap1ncv101-/-: 49% � 7.33, n = 22; p,0.0001). ( E) Quantification of the total number of LECs across 6 somites at 6 dpf (sibling: 37 � 1.91, n = 11; MZ yap1mw48-/-: 8 � 3.79; p<0.0001). ( F) Schematic showing the cell transplantation technique. Blastomere cells are transplanted from donor (EGFP) into host (mCherry) embryos. This results in a chimeric host embryo (right) with randomly located, transplanted EC grafts. ( G) Representative images of host chimeric trunk vessels at 5 dpf. Wildtype (wt) donor ECs contribute to all vascular EC types, while MZ yap1ncv101-/- mutant ECs show reduced propensity to contribute to lymphatic structures. Asterisk marks missing TD. Scale bars: 50 ?m. ( H) Graft sizes analysed for vascular grafts. Numbers within bars represent the number of embryos scored for each graft size. ( I) Percentage of embryos with EC grafts contributing to arterial (wt into wt: 96% � 4; MZ yap1ncv101-/- into wt: 100% � 0; p=0.31, not significant (ns)), venous (wt into wt: 91% � 6; MZ yap1ncv101-/- into wt: 67% � 10; p=0.04 (*)) and lymphatic vessels (wt into wt: 43% � 10; MZ yap1ncv101-/- into wt: 8% � 6; p=0.005 (**)). Wildtype into wildtype total number of EC grafts: n = 23; MZ yap1ncv101-/- mutant into wildtype total number of EC grafts: n = 24. Dorsal aorta (DA); Posterior Cardinal Vein (PCV); Thoracic Duct (TD); Intersegmental Lymphatic vessel (ISLV), Dorsal Longitudinal Lymphatic vessel (DLLV). |
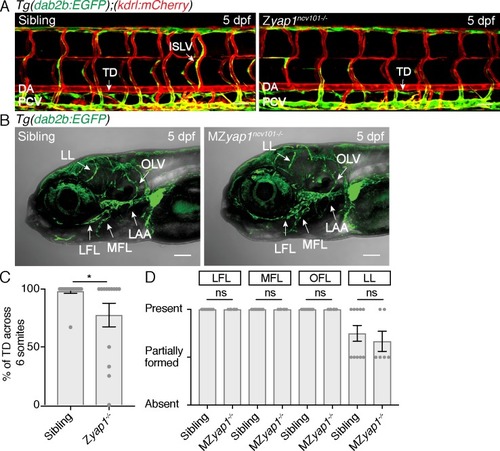
Z yap1-/- mutants only exhibit mild lymphatic defects in the trunk and MZ yap1-/- mutants form facial lymphatics.( A) Trunk lymphatics of sibling and Z yap1ncv101-/- mutant at 5 dpf. The vasculature is shown in red [ Tg(kdrl:mCherry)], venous and lymphatics in green [ Tg(dab2b:EGFP)]. Scale bar: 50 ?m. ( B) Heads of siblings and MZ yap1ncv101-/- mutants showing facial lymphatics including the lateral facial lymphatic (LFL), medial facial lymphatic (MFL), otolithic lymphatic vessel (OLV), branchial arch lymphatics (LAA); and developing lymphatic loop (LL). Scale bar: 50 ?m. ( C) Percentage of thoracic duct (TD) segments formed across 6 somites at 5 dpf in siblings (98.17 � 1.83, n = 18) and Z yap1ncv101-/- mutants (77.54 � 10.14, n = 13; p=0.0269). ( D) Score of facial lymphatics in siblings (LL: 0.75 � 0.08, n = 10) and MZ yap1ncv101-/- mutants (LL: 0.67 � 0.11, n = 6; p=0.55 (ns)). Each point represents the vessel score for one embryo. Matrix scores for LFL, MFL and OFL between sibling and MZ yap1ncv101-/- are identical, thus not significantly different. |
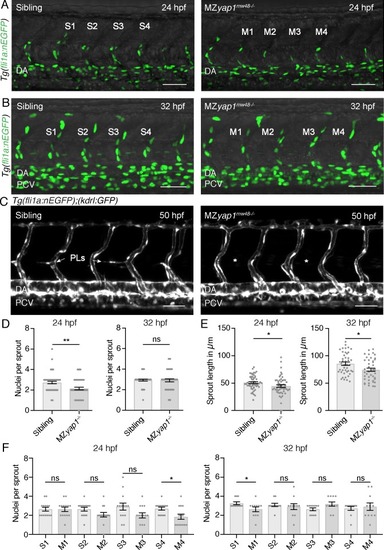
MZ yap1-/- mutants do not show major defects in blood vessel formation.( A) Blood vasculature (EC nuclei labelled in green) of sibling and MZ yap1mw48-/- mutant at 24 hpf. S1-4 indicate the quantified sprouts of the sibling and M1-4 the equivalent for the MZ yap1mw48-/- mutant in D?F). Dorsal aorta (DA). Scale bars in A?C): 50 ?m. ( B) Blood vasculature of [ Tg(fli1a:nEGFP)] sibling and MZ yap1mw48-/- mutant at 32 hpf. Posterior cardinal vein (PCV). ( C) Trunk vasculature of sibling and MZ yap1mw48-/- mutant at 50 hpf showing normal lumen formation in white ([ Tg(kdrl:GFP)]). Missing parachordal LECs (PLs) are marked by asterisks. ( D) Quantification of number of nuclei for all sprouts (S1-S4 for sibling, M1-4 for MZ yap1mw48-/-) at 24 hpf (sibling: 2.73 � 0.12, n = 56; MZ yap1mw48-/-: 2.14 � 0.13, n = 56; p=0.0013 (**)) and 32 hpf (sibling: 2.93 � 0.09, n = 44; MZ yap1mw48-/-: 2.91 � 0.15, n = 44; p=0.90 (ns)). ( E) Sprout length for all sprouts in ?m (S1-S4 for sibling, M1-4 for MZ yap1mw48-/-) at 24 hpf (sibling: 50.91 � 1.70, n = 56; MZ yap1mw48-/-: 44.74 � 2.32, n = 56; p=0.034 (*)) and 32 hpf (sibling: 85.57 � 2.98, n = 44; MZ yap1mw48-/-: 74.57 � 3, n = 44; p=0.01 (*)). ( F) Quantification of nuclei number in single sprouts at 24 hpf (S1: 2.64 � 0.20, n = 14, M1: 2.64 � 0.23, n = 14, p>0.99 (ns); S2: 2.64 � 0.19, n = 14, M2: 2.07 � 0.25, n = 14, p=0.08 (ns); S3: 2.93 � 0.37, n = 14, M3: 2.00 � 0.28, n = 14, p=0.05 (ns); S4: 2.71 � 0.16, n = 14, M4: 1.86 � 0.27, n = 14, p=0.01 (*)) and 32 hpf (S1: 3.27 � 0.14, n = 11, M1: 2.64 � 0.24, n = 11, p=0.04 (*); S2: 3.09 � 0.16, n = 11, M2: 2.91 � 0.31, n = 11, p=0.61 (ns); S3: 2.63 � 0.15, n = 11, M3: 3.18 � 0.23, n = 11, p=0.06 (ns); S4: 2.73 � 0.20, n = 11, M4: 2.91 � 0.39, n = 11, p=0.68 (ns)). |
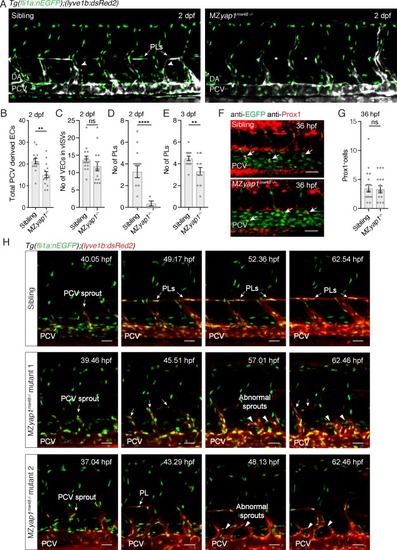
MZ yap1-/- mutants display defects in LEC numbers but not specification.( A) Trunk vasculature (EC nuclei in green, veins and lymphatics in white) of sibling and MZ yap1mw48-/- mutant at 2 dpf. Arrowheads indicate posterior cardinal vein (PCV) sprouts. Asterisks mark absent parachordal LECs (PLs). Dorsal aorta (DA). Scale bars: 50 ?m. ( B) Total number of lyve1-positive ECs departing the PCV across 6 somites at 2 dpf. ( C) Number of endothelial cells in venous intersegmental vessels (vISV) across 6 somites at 2 dpf (sibling: 13 � 0.94, n = 14; MZ yap1-/-: 12 � 1.33, n = 14; p=0.24 (ns)). ( D) Number of PLs scored across 6 somites at 2 dpf (sibling: 3 � 0.56, n = 14; MZ yap1-/-: 0.36 � 0.23, n = 14; p<0.0001 (****)). ( E) Number of PLs scored across 6 somites at 3 dpf (sibling: 4.5 � 0.20, n = 14; MZ yap1-/-: 3.31 � 0.36, n = 13; p=0.0075(**)). ( F) Immunofluorescence staining for EC nuclei (green) and Prox1 (red) in sibling and MZ yap1mw48-/- mutants at 36 hpf. Arrows point to Prox1+ LEC progenitors. Scale bars: 30 ?m. ( G) Quantification of Prox1 +cells in PCV and CV sprouts scored across 6 somites at 36 hpf (sibling: 3.47 � 0.65, n = 19; MZ yap1-/-: 3.31 � 0.61, n = 16; p=0.86 (ns)). ( H) Maximum projection stills from time-lapse Videos from 32 to 65 hpf. Sibling still images show normal lymphangiogenesis with PCV sprouts, PL formation, sprout detachment and PL proliferation (upper panels). MZ yap1mw48-/- mutant one displays abnormal sprouting and looping of PCV sprouts that are retained until the end of the Video (central panels). MZ yap1mw48-/- mutant two also exhibits abnormal sprouting and PCV loop formation but also forms PLs (lower panels). Scale bars: 25 ?m. Timelapse imaging began at 32 hpf. |
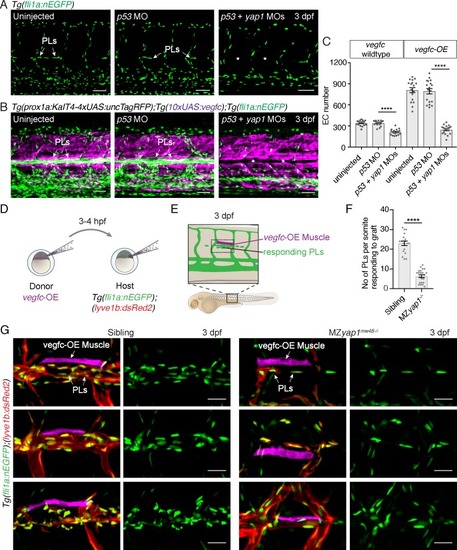
Yap1 mediates endothelial cell proliferation downstream of Vegfc.( A) Trunk vasculature at 3 dpf displaying endothelial cells (ECs) in green from uninjected, p53 morpholino (MO) injected and p53 +yap1 MO injected embryos. Asterisks highlight missing parachordal LECs (PLs). Scale bars: 50 ?m. ( B) Trunk vasculature at 3 dpf from uninjected, p53 MO injected and p53 +yap1 MOs injected embryos of the Tg(prox1a:KalT4xUAS:uncTagRFP); Tg(10xUAS:vegfc) strain. yap1 MO injection rescues the EC proliferation phenotype. ECs in green. Asterisks mark missing PLs. Scale bars: 50 ?m. ( C) Quantification of total EC number across four somites in vegfc-unstimulated (uninjected: 343 � 9, n = 18; p53MO: 341 � 9, n = 18; p53 +yap1 MOs: 248 � 15, n = 18; p<0.0001(****)) and vegfc-stimulated embryos (uninjected: 811 � 35, n = 18; p53 MO: 794 � 38, n = 18; p53 +yap1 MOs: 212 � 10, n = 18; p<0.0001(****)). ( D) Schematic representation of vegfc-overexpressing cell transplantations for single muscle grafts in [ Tg(fli1a:nEGFP);(?5.2lyve1b:DsRed2)] hosts of siblings and MZ yap1mw48-/- mutants. ( E) Schematic of transplanted host embryo at 3 dpf. Muscle grafts produce excessive Vegfc causing a hyperproliferation response in adjacent PLs. ( F) Quantification of PL number within one somite responding to the vegfc-OE single muscle graft at 3 dpf (sibling: 23.00 � 1.19, n = 18; MZ yap1mw48-/-: 6.36 � 0.71, n = 22; p<0.0001 (****)). ( G) Examples of 3 different vegfc-OE muscle grafts (false coloured) in siblings (left panels) and MZ yap1mw48-/-mutants (right panels). Merge images show ECs in green, lymphatic and venous ECs are red (yellow) [ Tg(fli1a:nEGFP);(?5.2lyve1b:DsRed2)]. Scale bars: 25 ?m. |

Yap1 mediates endothelial cell proliferation downstream of VegfVegfc promotes nuclear Yap1 in developing lymphatic progenitors.( A) Schematic showing the transplantation of vegfc-OE cells into EGFP-YAP reporter hosts. ( B) Trunk vasculature of YAP reporter host embryos with neuron and muscle grafts expressing RFP (magenta) at 56 hpf. Control grafts (left) and vegfc-OE grafts (right). Posterior cardinal vein (PCV); Muscle ( M); parachordal LECs (PLs); Neuron ( N). Scale bars: 50 ?m in B and C. ( C) Heatmaps of maximum projections of EGFP-YAP from B) showing PLs and PCV. Red corresponds to high EGFP-YAP fluorescence. ( C?) Lower panels show heatmaps of EGFP-YAP in PL nuclei. ( D) EGFP intensity for each PL expressed as a ratio to the average of 6 dorsal aorta (DA) cells (unresponsive to vegfc). six embryos per group: untransplanted host (control) (PL n = 27), transplanted control without the UAS:vegfc construct (TP Control) (PL n = 40) and vegfc-OE transplanted embryos (TP vegfc-OE) (PL n = 251). Individual embryos indicated by an individual grey shade. ( E) Heatmaps of EGFP-YAP depicting PL nuclei of embryos at 66 hpf that were treated with DMSO (left) and SL327 for 13 hr (hrs) (right). Max projections are from time-lapse Videos. Scale bars: 30 ?M. ( F) EGFP mean intensity for each PL/DA in panel D (Control: 1.61 � 0.13, n = 27; TP Control: 1.93 � 0.12, n = 40; p=0.08 (ns); TP vegfc-OE: 3.14 � 0.07, n = 251; p<0.0001(****)). ( G) Quantification of PL number across six somites for each group (Control: 5 � 0.26, n = 6; TP Control: 8 � 0.78, n = 16; p=0.0157 (*); TP vegfc-OE: 44 � 8.04, n = 16; p=0.0001(***)). ( H) Quantifications of the mean EGFP/mCherry fluorescent intensity ratio in PL nuclei from time-lapse Video stills. Embryos were mounted in DMSO as control (n = 5) or SL327 (15 ?M) (n = 5) and continuously imaged for 12 hr starting at 54 hpf (1 hr drug treatment), finishing at 66 hpf (13 hr) (1 hr DMSO: 0.33 � 0.02, n = 20; 1 hr SL327: 0.24 � 0.02, n = 23; p=0.0036 (**)) (13 hr DMSO: 0.39 � 0.02, n = 20; 13 hr SL327: 0.26 � 0.03, n = 16; p=0.0006(***)). ( I) Quantifications of mean EGFP/mCherry Ratio in PLs of embryos at 66 hpf treated with DMSO/SL327 for 12 hr from 54 hpf to 66 hpf without time-lapse imaging (12 hr DMSO: 0.47 � 0.02, PLs n = 43; 13 hr SL327: 0.37 � 0.03, PLs n = 22; p=0.02 (*)). ( J) Quantification of PL number in embryos treated with DMSO/SL327 for 12 hr at 66 hpf without time-lapse imaging (12 hr DMSO: 8.6 � 1.08, embryo n = 5; 13 hr SL327: 4.4 � 0.81, embryo n = 5; p=0.014 (*)). |
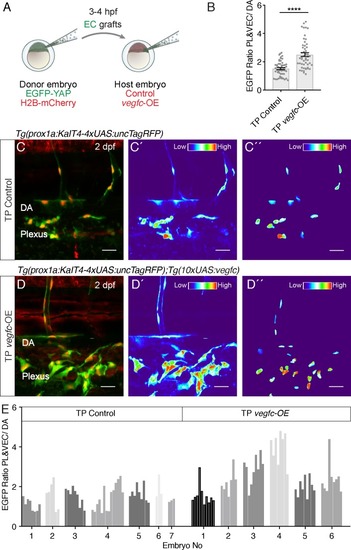
The autonomous EGFP-YAP response to Vegfc in transplanted ECs.( A) Schematic displaying the transplantation of [ Tg(fli1a:EGFP-YAP),(fli1a:H2B-mCherry)] endothelial cells (ECs) into control (no aberrant vegfc) and vegfc-overexpression (OE) host embryos at 3?4 hpf. ( B) Average Nuclear EGFP Intensity as ratio of vegfc-responsive cells (parachordal LECs (PLs) and venous ECs (VECs))/ vegfc unresponsive dorsal aorta (DA) cells. Grafted ECs in the TP vegfc-OE hosts show a higher amount of nuclear EGFP-YAP compared to the TP Control (TP Control: 1.52 � 0.07, n = 52; TP vegfc-OE: 2.51 � 0.14, n = 52; p=0.0001(****)). ( C?D) Maximum projections of transplanted EGFP-YAP EC grafts in control hosts ( C) and vegfc-OE hosts ( D) at 2 dpf. Scale bars: 25 ?m. ( C?) shows the EGFP fluorescence as heatmap of the maximum projections for TP control and ( D?) for TP vegfc-OE (red indicates high EGFP fluorescence) (central panels). ( C?) and ( D?) display nuclear EGFP-YAP in PCV and PL ECs as a heatmap (right panels). ( E) Nuclear EGFP average pixel intensity as a ratio of vegfc- responsive cells (PLs and VECs) and vegfc-unresponsive cells (DA cells) for EC grafts in TP control (n = 7) and TP vegfc-OE host embryos (n = 6). Each grey shade represents a different embryo, each bar shows the EGFP-YAP fluorescent ratio of a vegfc-responsive cell nucleus. Statistics are shown in B. |