
|
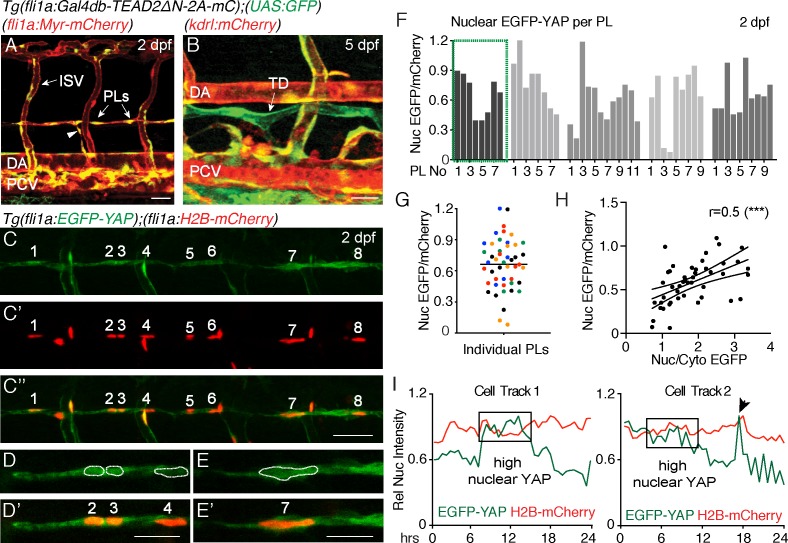
Fig. 1
Nuclear EGFP-YAP changes dynamically in the developing trunk lymphatic vasculature.
( A?B) The TEAD reporter line [ Tg(fli1:Gal4db-TEAD2?N-2A-mC);(UAS:GFP)] shows Yap1 activity in vasculature, parachordal LECs (PLs) and cardinal vein sprouts (arrowhead) of the 2 dpf trunk ( A) as well as in the thoracic duct (TD) at 5 dpf ( B). Scale bars: 40 ?m. ( C) Maximum projection of 8 PLs in a two dpf embryo showing EGFP-YAP in green [ Tg(fli1:EGFP-YAP)] and the nucleus in red ( C?), [ Tg(flil:H2B-mCherry)] and merge ( C??). Scale bar: 25 ?m. ( D?E) High power single z-sections of selected PLs from C, showing nuclear YAP in PL2 and PL3, but low nuclear YAP in PL4 ( D?D?) and PL7 ( E?E?). Scale bars: 10 ?m. ( F) Quantification of nuclear EGFP/mCherry average pixel intensity across individual PLs from multiple embryos at 2 dpf. Each bar represents a single PL (n = 47), each grey shade a different embryo (n = 5). PLs in ( C and D) highlighted in the green box. EGFP/mCherry Ratios have been calculated using mean fluorescent intensities in 3D. ( G) Scatter Plot of the Nuclear EGFP/mCherry average pixel intensity for individual PLs (n = 5 embryos). Each colour indicates PLs from a different embryo. Values calculated in 3D measurements of the mean fluorescent intensity for EGFP and mCherry (0.66 � 0.04, n = 47). ( H) Pearson Correlation Plot of the Nuclear EGFP/mCherry Ratio values in F and the Nuclear/Cytoplasmic EGFP Ratio values in Figure 1?figure supplement 1B (r = 0.52, 95% confidence intervals: 0.27 to 0.70, R square = 0.27, p=0.0002(***)). The two distinct approaches produce correlative measurements. ( I) Average nuclear pixel intensity graphs from cell tracks of single PLs time-lapse imaged from 2 to 3 dpf. EGFP-YAP intensity (green) is compared over time with H2B-mCherry (red) intensity in individual nuclei. Arrow points to a cell division during time-lapse.