
Fig. 5 S1
- ID
- ZDB-FIG-190723-190
- Publication
- Grimm et al., 2019 - Yap1 promotes sprouting and proliferation of lymphatic progenitors downstream of Vegfc in the zebrafish trunk
- Other Figures
- All Figure Page
- Back to All Figure Page
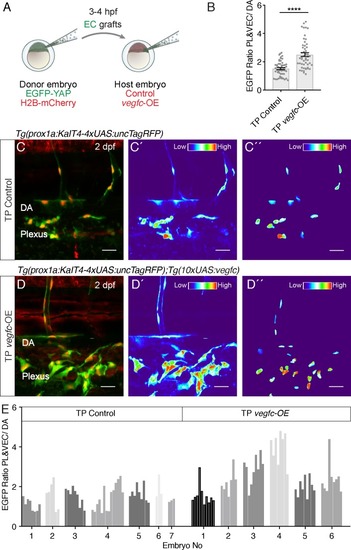
The autonomous EGFP-YAP response to Vegfc in transplanted ECs.( A) Schematic displaying the transplantation of [ Tg(fli1a:EGFP-YAP),(fli1a:H2B-mCherry)] endothelial cells (ECs) into control (no aberrant vegfc) and vegfc-overexpression (OE) host embryos at 3?4 hpf. ( B) Average Nuclear EGFP Intensity as ratio of vegfc-responsive cells (parachordal LECs (PLs) and venous ECs (VECs))/ vegfc unresponsive dorsal aorta (DA) cells. Grafted ECs in the TP vegfc-OE hosts show a higher amount of nuclear EGFP-YAP compared to the TP Control (TP Control: 1.52 � 0.07, n = 52; TP vegfc-OE: 2.51 � 0.14, n = 52; p=0.0001(****)). ( C?D) Maximum projections of transplanted EGFP-YAP EC grafts in control hosts ( C) and vegfc-OE hosts ( D) at 2 dpf. Scale bars: 25 ?m. ( C?) shows the EGFP fluorescence as heatmap of the maximum projections for TP control and ( D?) for TP vegfc-OE (red indicates high EGFP fluorescence) (central panels). ( C?) and ( D?) display nuclear EGFP-YAP in PCV and PL ECs as a heatmap (right panels). ( E) Nuclear EGFP average pixel intensity as a ratio of vegfc- responsive cells (PLs and VECs) and vegfc-unresponsive cells (DA cells) for EC grafts in TP control (n = 7) and TP vegfc-OE host embryos (n = 6). Each grey shade represents a different embryo, each bar shows the EGFP-YAP fluorescent ratio of a vegfc-responsive cell nucleus. Statistics are shown in B. |