- Title
-
Wnt8a expands the pool of embryonic kidney progenitors in zebrafish
- Authors
- Naylor, R.W., Han, H.I., Hukriede, N.A., Davidson, A.J.
- Source
- Full text @ Dev. Biol.
|
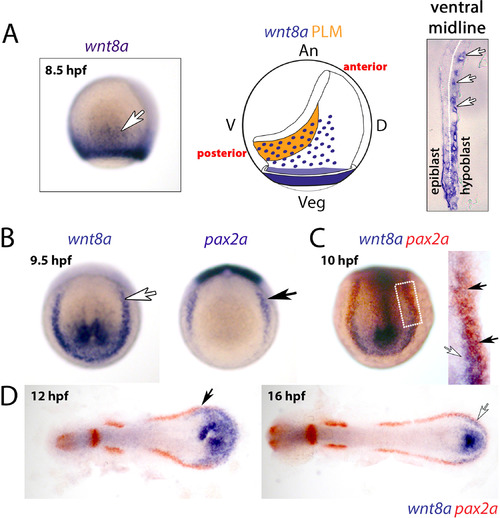
Expression of wnt8a and pax2a. A) Left panel shows a lateral view of a whole mount 85% epiboly stage embryo stained for wnt8a, with the white arrow indicating wnt8a+ cells in the region of the posterior lateral mesoderm. The schematic in the middle highlights the position of the posterior lateral mesoderm in relation to the wnt8a+ cells at 85% epiboly. Right panel shows a sagittal section through the ventral midline with white arrows indicating wnt8a+ cells in the hypoblast layer. B) Panels show posterior views of 9.5 hpf stage embryos stained for wnt8a and pax2a transcripts. White arrow in left panel identifies wnt8a expression in the presumptive intermediate mesoderm; black arrow in the right panel identifies the intermediate mesoderm labelled by pax2a. C) Caudal view of 10 hpf stage embryo co-labelled for wnt8a (purple) and pax2a (red) transcripts. Right panel shows a high magnification view of the intermediate mesoderm, black arrows indicate co-staining of wnt8a and pax2a and white arrow highlights a more caudal and medial domain that is wnt8a+ but pax2a-. D) Dorsal views of flat mounted 12 hpf and 16 hpf embryos (anterior to the left) showing wnt8a (purple) and pax2a (red) double labelling. Black arrow in the left panel identifies the posterior-most limit of the intermediate mesoderm; white arrow in right panel identifies caudal pax2a+/wnt8a+ cells. Abbreviations are: An, Animal; V, Ventral; D, Dorsal; Veg, Vegetal; PLM, Posterior Lateral Mesoderm; hpf, hours post fertilization. EXPRESSION / LABELING:
|
|
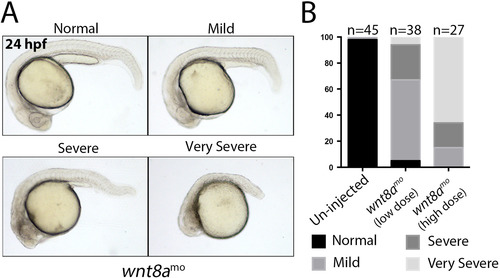
Morphological defects in wnt8a morphants. A) Panels show lateral views of live wnt8a morphants displaying the classes of phenotype severity. B) Histogram showing the proportion of phenotype classes observed in un-injected and wnt8a morphants injected with a low dose (2 ng/embryo) and a high dose (15 ng/embryo) of morpholino. PHENOTYPE:
|
|
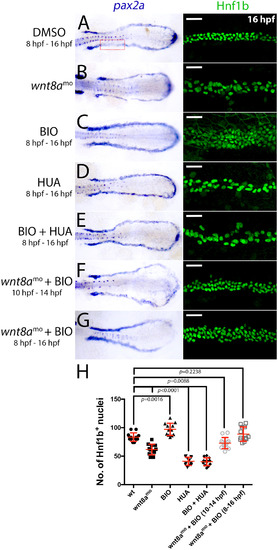
Effects of wnt8a knockdown and BIO on renal progenitor cell number. A-G) Left panels show flat mounted dorsal views of the trunks of 16 hpf embryos stained for pax2a transcripts and treated as indicated. Right panels show close-up views Hnf1b+ nuclei in the proximal pronephros (location indicated by the red dotted box in the embryo in A). Scale bar represents 50 Ám. H) Scatter-graph showing empirical counts of Hnf1b+ nuclei after the various treatments shown. EXPRESSION / LABELING:
PHENOTYPE:
|
|
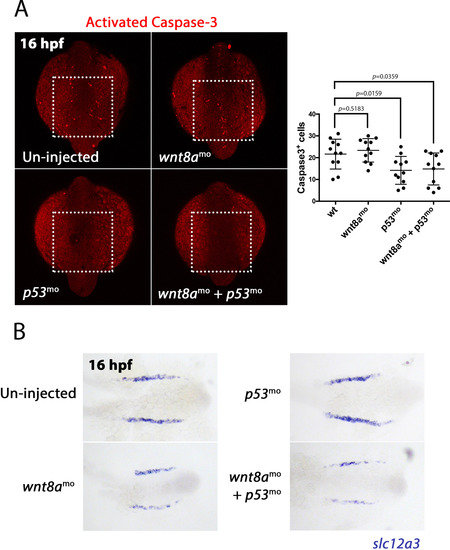
Effect of wnt8a knockdown on apoptosis. A) Left panels show dorsal views of the posterior region of 16 hpf embryos stained for activated Caspase3 and treated as indicated. Dashed line box indicates the region used to count the number of Caspase3+ cells. Scatter-graph on the right illustrates the counts for Caspase3+ cells. B) Panels show dorsal views of the posterior region of flat mounted embryos stained for slc12a3 transcripts at 16 hpf and treated as indicated. EXPRESSION / LABELING:
PHENOTYPE:
|
|
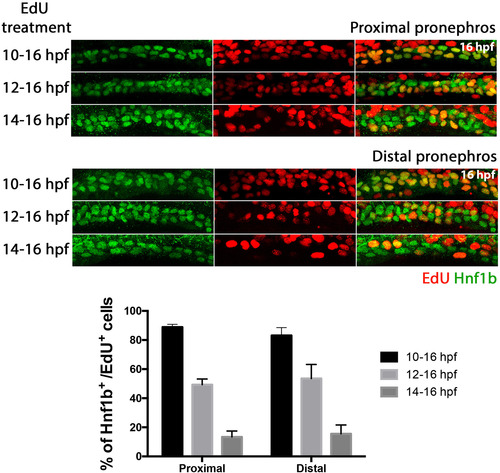
Characterisation of renal cell proliferation between 10 and 16 hpf. The top nine panels show Hnf1b/ EdU staining in the proximal pronephros. The bottom nine panels show Hnf1b/ EdU staining in the distal pronephros. The varying lengths of EdU treatment are indicated to the left of each panel. Hnf1b staining is shown in the left panels, middle panels show EdU staining and right panels show merged images of Hnf1b/EdU staining. Histogram shows the percentage of Hnf1b+ cells that were also EdU+ for each EdU treatment window. EXPRESSION / LABELING:
|
|
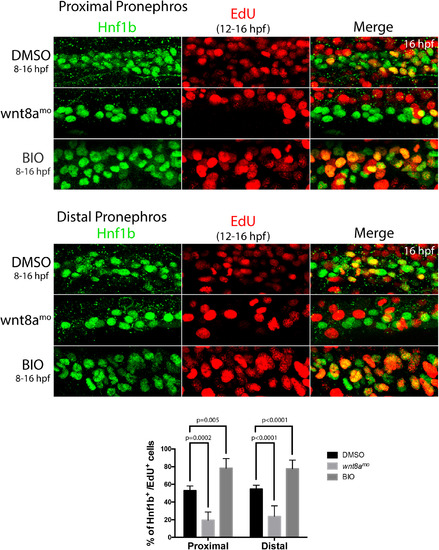
Effect of wnt8a knockdown on kidney cell proliferation. Panels show Hnf1b/ EdU staining in the proximal and distal pronephros in response to wnt8a knockdown or BIO treatment as indicated. Histogram shows percentage of Hnf1b+ cells that were also EdU+. EXPRESSION / LABELING:
PHENOTYPE:
|
|
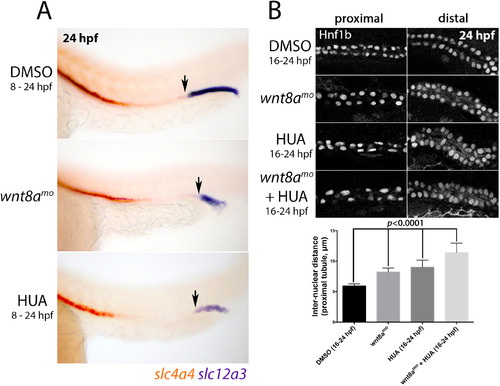
Effect of wnt8a knockdown on inter-nuclear distance. A) Lateral views of 24 hpf embryos stained for slc4a4 (red) and slc12a3 (purple). Black arrows identify the anterior end of the slc12a3+ DL segment. B) Panels show lateral views of the pronephric tubule (proximal left, distal right) stained for Hnf1b to identify the nucleus of renal epithelial cells in response to wnt8a knockdown and/or HUA treatment. Histogram shows the average inter-nuclear distances of cells in the proximal region of the pronephros for each treatment. |
|
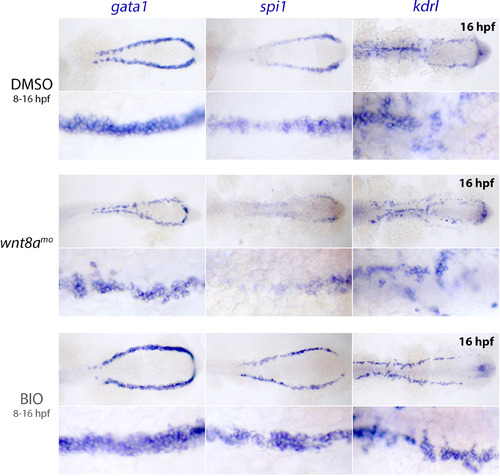
wnt8a knockdown reduces the number of gata1+ and spi1+ blood progenitors. Top panels of each treatment show flat mounted dorsal views of the trunks of 16 hpf embryos stained for gata1, spi1 and kdrl after the indicated treatments. Bottom panels are higher magnification views of the corresponding panel above. EXPRESSION / LABELING:
PHENOTYPE:
|
|
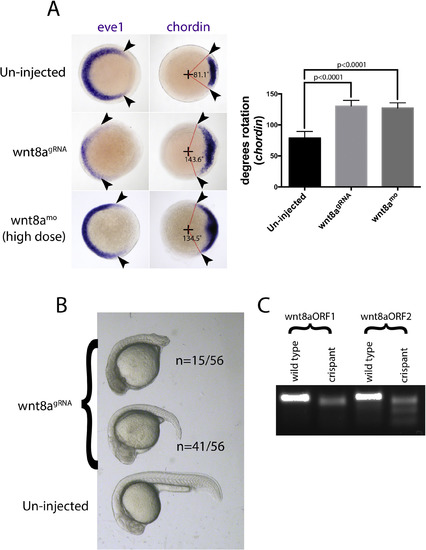
wnt8a crispants show similar phenotypes to a high dose of wnt8a morpholino. A) Left panels show eve1, right panels show chordin at 6 hpf in un-injected controls, wnt8a crispants and wnt8a morphants (injected with a high dose of morpholino, 15 ng/embryo). Views are looking down at the animal pole with posterior to the left and anterior (organiser) to the right. Arrowheads indicate the ends of the expression domains. Histogram on the right shows quantification of the chordin expression domain relative to the animal pole (given as degrees of rotation, as indicated on the chordin panels, n=10 for each series). B) Lateral views of 24 hpf wnt8a crispants (top two embryos) and an un-injected control for comparison. C) Gel showing the result of a T7 endonuclease 1 assay performed on genomic DNA to detect mutations. In the two crispant columns, the PCR product is degraded relative to the wild-type control indicating efficient mutagenesis. |
|
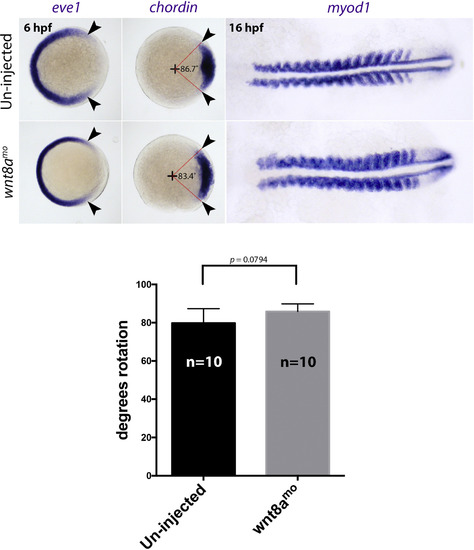
wnt8a knock down does not affect early dorsal ventral patterning. Top panels show controls, bottom panels show embryos injected with 2 ng wnt8a morpholino. The effects on eve1 (left panels) and chordin (middle panels) at 6 hpf and myod at 16 hpf (right panels) are shown. The eve1 and chordin panels are shown as animal views looking down on the shield stage embryo, and the myod panels are dorsal views of flat mounted embryos. Histogram shows quantification of the chordin expression domain relative to the animal pole (given as degrees rotation, as indicated on the chordin panels). |
|
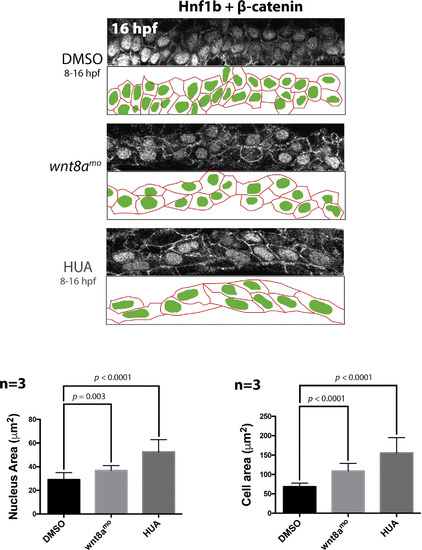
A low dose of wnt8a morpholino and HUA increase the size of pronephric cells and nuclei. Top panels show co-labelling for Hnf1b and ?-catenin at 16 hpf after the indicated treatments. Views are dorsal images of the proximal tubule, with lower panels showing schematics of the outlines of pronephric cells and nuclei from the image above. Histograms show nuclear and cell sizes (?m2) of 10 proximal tubule cells in three different animals. Comparing the ratio of the lengths of the AP and DV axes of the cells in each treatment (in ?ms), we find that when 10 cells in three different embryos were measured, the AP:DV in un-injected controls is 1:1.2. In wnt8a morphants the AP:DV ratio is 1.6:1, and in HUA treated animals it is 2.9:1. These results demonstrate the cells are stretched in wnt8a depleted and HUA treated animals relative to controls. |
|
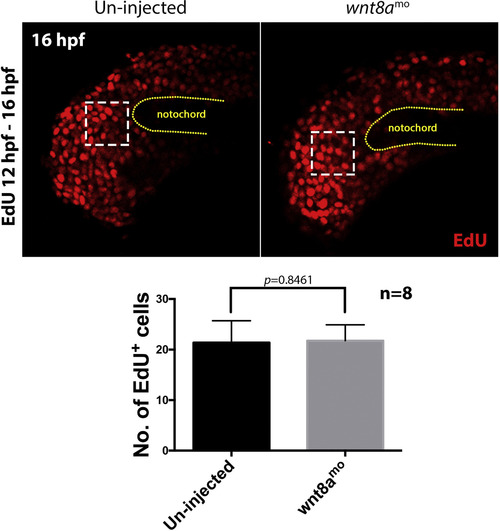
A low dose of wnt8a morpholino does not affect cell division in the tailbud. Top panels show lateral views of the tailbud at 16 hpf stained for EdU incorporation. EdU treatment was performed between 12 hpf to 16 hpf in un-injected (left panel) and wnt8amo injected (right panel) embryos. Yellow outline marks the end of the notochord and the number of EdU+ cells was counted in the dashed white line boxed area. Histogram below represents quantification of the EdU+ cell counts from 8 embryos in each treatment. |
|
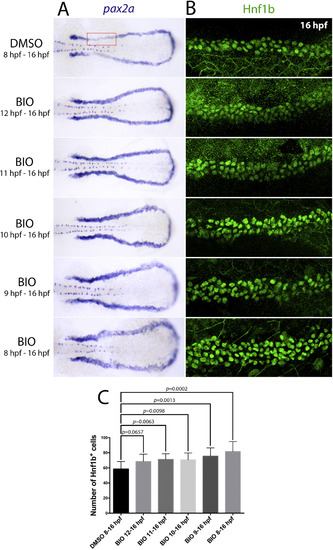
BIO treatment expands pronephric cell numbers when treatment commences from 12 hpf. A) Panels show flat mounted embryos stained for pax2a after the indicated treatments at 16 hpf. B) Close up views of the proximal pronephros at 16 hpf stained for Hnf1b after the indicated treatments are shown. C) Histogram illustrating the counts of Hnf1b+ nuclei in the various BIO treatments. |
Reprinted from Developmental Biology, 425(2), Naylor, R.W., Han, H.I., Hukriede, N.A., Davidson, A.J., Wnt8a expands the pool of embryonic kidney progenitors in zebrafish, 130-141, Copyright (2017) with permission from Elsevier. Full text @ Dev. Biol.

