- Title
-
First quantitative high-throughput screen in zebrafish identifies novel pathways for increasing pancreatic ?-cell mass
- Authors
- Wang, G., Rajpurohit, S.K., Delaspre, F., Walker, S.L., White, D.T., Ceasrine, A., Kuruvilla, R., Li, R.J., Shim, J.S., Liu, J.O., Parsons, M.J., Mumm, J.S.
- Source
- Full text @ Elife
|
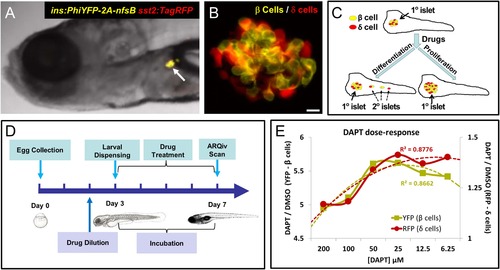
Screening resources, design, and controls. (A) Transgenic line used for the primary screen, Tg(ins:PhiYFP-2a-nsfB, sst2:tagRFP)lmc01 (β/? reporter; Walker et al., 2012), the insulin promoter drives YFP-expression in β cells (yellow), the somatostatin 2 promoter drives RFP expression in neighboring ? cells (red). Photomicrograph of the anterior region of a 7 dpf larva shows YFP and RFP labeling of the principal islet (arrow). (B) Confocal z-projection of the principal islet in a β/?-reporter fish (scale bar: 10 ÁM), YFP labeling β cells (yellow) and RFP labeling ? cells (red)-note, apparent ?orange? co-labeling is an artifact of z-projection in 2D format. (C) Illustration of two potential mechanisms by which drug exposures could lead to increased β-cell mass: (1) enhanced endocrine differentiation, indicated by secondary (2░) islet formation (left path) and (2) increased β-cell proliferation, indicated by supernumerary β cell numbers in the principal islet (right path) in the absence of effects on endocrine differentiation-that is, no effect on 2░ islet formation. (D) Schematic of the ARQiv-HTS screening process: Day 0, mass breeding produced 5000-10,000 eggs per day; Day 2 (evening), JHDL compounds were serially diluted into drug plates; Day 3, the COPAS-XL (Union Biometrica) was used to dispense individual 3 dpf larvae into single wells of drug plates, and plates were then maintained under standard conditions for 4 days; Day 7, larvae were anesthetized and reporters quantified by automated reporter quantification in vivo (ARQiv). (E) β/?-reporter larvae were exposed to 0.1% DMSO (negative control) or the γ-secretase/Notch inhibitor DAPT (positive control) at six different concentrations from 3 to 7 dpf. ARQiv was then used to measure fluorescent signals from β cells (yellow line, left y-axis) and ? cells (red line, right y-axis). The DAPT to DMSO ratio (DAPT/DMSO) was used to indicate signal strength for each fluorophore independently, as per the primary screen. The β-cell data show a non-monotonic dose response (yellow dashed line, polynomial curve fit), with maximal signal observed at 25-50 ÁM DAPT. The ?-cell data show a similar trend (red dashed line, polynomial curve fit), but with approximately fourfold lower signal strength due to higher autofluorescent background in the RFP emission range. EXPRESSION / LABELING:
|
|
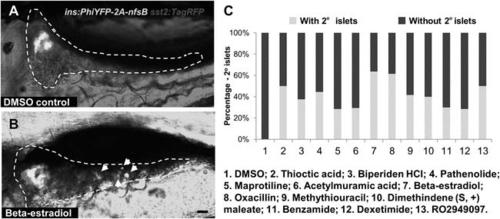
Observation of 2o islet formation in live β/?-reporter larvae after drug treatment. (A, B) Representative in vivo confocal images - brightfield and fluorescence images merged-of pancreata in β/?-reporter larvae following treatment with 0.1% DMSO (A) or a representative Hit I drug (B, Beta-estradiol) from 3 to 7 dpf. White arrows indicate 2░ islets in the tail of the pancreas. Scale bar = 25 Ám. (C) Percentages of larvae having 2░ islets following treatment from 3 to 7 dpf with the indicated control of Hit I compounds at optimal concentrations. n > 20. negative control: 0.1% DMSO. Positive control: RO2949097 (5 ÁM). |
|
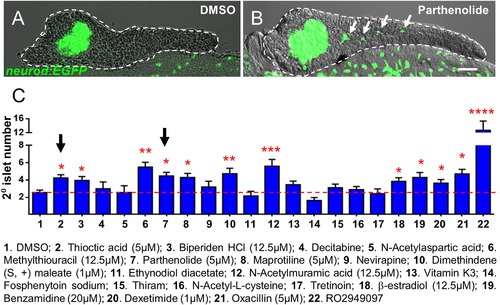
Validation of endocrine differentiation induction: precocious 2░ islet assay. (A, B) Representative confocal images - brightfield and fluorescence images merged - of dissected pancreata (dashed lines) from neurod:EGFP transgenic larvae treated from 3 to 5 dpf with 0.1% DMSO (A) or a Hit I drug (B, example shown is parthenolide). Early endocrine cells are labeled with GFP (green) allowing precocious formation of 2░ islets (white arrows) to be visualized following drug exposures. (C) The number of precocious 2░ islets was quantified following treatment with the indicated Hit I compounds from 3 to 5 dpf. Results obtained with the optimal concentration were plotted relative to negative (0.1% DMSO) and positive controls (RO2949097, 5 ÁM). Of 20 Hit I compounds tested, 11 were confirmed as Lead I drugs for inducing endocrine differentiation (optimal concentrations for validated leads are shown in parentheses). Arrows indicate drugs that inhibit NF-κB signaling. Scale bar, 25 Ám. Error bars, standard error. All p-values were calculated using Dunnett′s test. *p < 0.05, **p < 0.01, ***p < 0.001, ****p < 0.0001. n = 5?10 larvae per condition, experiment was repeated 3 times per compound. |
|
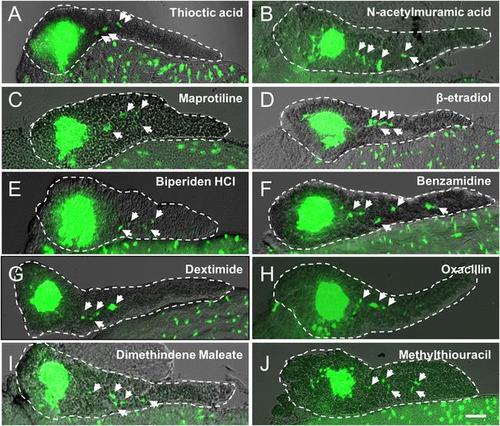
Validation of endocrine differentiation induction: precocious 2░ islet assay (neurod reporter). Precocious 2░ islet assays were performed as per Figure 3. (A-J) Representative confocal images - brightfield and fluorescence images merged - of dissected pancreata (dashed lines) from neurod:EGFP transgenic larvae treated with indicated Lead I compounds (at optimal concentrations) from 3 to 5 dpf: (A) Thioctic acid (5 ÁM); (B) N-acetylmuramic acid (12.5 ÁM); (C) Maprotiline (5 ÁM); (D) β-estradiol (12.5 ÁM); (E) Biperiden HCl (12.5 ÁM); (F) Benzamidine (20 ÁM); (G) Dexetimide (1 ÁM); (H) Oxacillin (5 ÁM); (I) Dimethindene (S, +) maleate (1 ÁM); (J) Methylthiouracil (12.5 ÁM). Secondary islets are indicated by arrows. Scale bar, 25 Ám. |
|
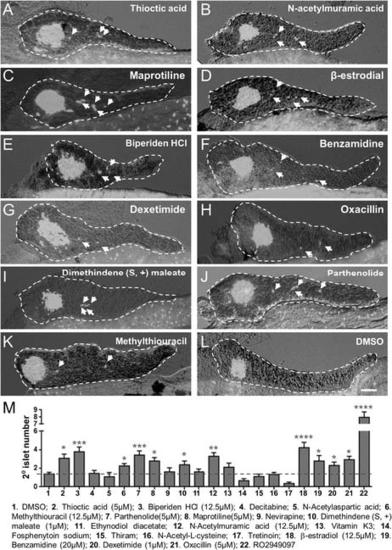
Validation of endocrine differentiation induction: precocious 2░ islet assay (pax6b reporter). Precocious 2░ islet assays were performed as per Figure 3. (A-L) Representative confocal images - brightfield and fluorescence images merged - of dissected pancreata (dashed lines) from pax6b:EGFP transgenic larvae treated with indicated Lead I compounds (at optimal concentrations) from 3 to 5 dpf: (A) Thioctic acid (5 ÁM); (B) N-acetylmuramic acid (12.5 ÁM); (C) Maprotiline (5 ÁM); (D) β-estradiol (12.5 ÁM); (E) Biperiden HCl (12.5 ÁM); (F) Benzamidine (20 ÁM); (G) Dexetimide (1 ÁM); (H) Oxacillin (5 ÁM); (I) Dimethindene (S, +) maleate (1 ÁM); (J) Parthenolide (5 ÁM); (K) Methylthiouracil (12.5 ÁM). Secondary islets are indicated by arrows. (M) The number of precocious 2░ islets was quantified following treatment with the indicated Hit I compounds from 3 to 5 dpf. Results obtained with the optimal concentration were plotted relative to negative (0.1% DMSO) and positive controls (RO2949097, 5 ÁM). The same 11 Lead I compounds validated with the neurod:GFP reporter line (Figure 3, Figure 3 - figure supplement 1, Table 1) showed significant results - albeit producing fewer numbers of 2░ islets than the neurod:EGFP line. Scale bar, 25 Ám. All p-values were calculated using Dunnett′s test. *p < 0.05, **p < 0.01, ***p < 0.001, ****p < 0.0001. n = 5-10 larvae per condition, experiment was repeated 3 times per compound. |
|
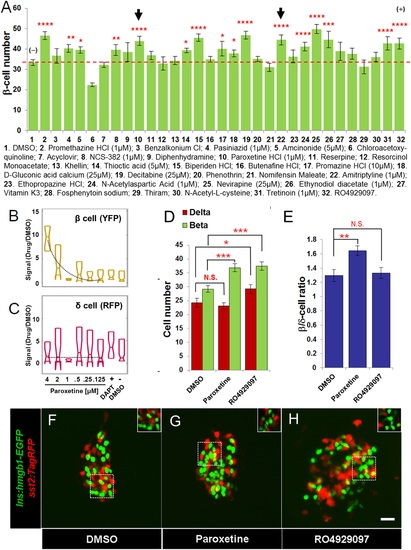
Validation of increased β-cell proliferation: cell counts. (A) Quantification of β-cell numbers following incubation of ins:hmgb1-EGFP transgenic larvae from 3 to 5 dpf in one of 30 Hit compounds, 0.1% DMSO, or the Notch inhibitor RO4929097 (5 ÁM). 15 compounds were confirmed as Lead II drugs for increasing β-cell numbers. Arrows indicate drugs that enhance serotonin signaling. (B, C) ARQiv screen data for paroxetine: box plots of β cells (B) and δ cells (C) suggest a β cell-specific effect - that is, a dose-response in YFP but not RFP signal (dashed line, single polynomial curve fit). (D) Numbers of δ cells (red bars) and β cells (green bars) were quantified following treatment with paroxetine, 0.1% DMSO, or RO4929097. Increased β-cell numbers were seen following paroxetine and RO4929097 treatments. However, only RO4929097 increased both β and δ cells. (E) Ratio of the number of β cells to δ cells, which confirms that the number of β cells increases following paroxetine treatment relative to δ cells, suggesting cell-type selective effects. Error bars, standard error. n = 5-10 larvae per condition, experiment was repeated 2-3 times per compound. (F-H) Representative z-projection confocal images of the principal islets in dissected pancreata (post-paraformaldehyde fixation) fromTg(ins:hmgb1-EGFP; β/δ-reporter ) triple transgenic lines treated with DMSO (F), paroxetine (G), or RO4929097 (H). Shown are EGFP+ β-cell nuclei (green) and TagRFP+ δ cells (red); note, PhiYFP in the β/δ-reporter line does not withstand fixation, allowing ?clean? labeling of β-cell nuclei with EGFP. In addition, apparent overlap between the β-cell and δ-cell markers (i.e., occasional ?yellow? cells) is an artifact of z-projection images shown in 2D format. For clarity, the inset panels show a single z-slice image of partial islet showing no co-localization of cell type specific reporters. All p-values were calculated using Dunnett′s test. *p < 0.05, **p < 0.01, ***p < 0.001, ****p < 0.0001. N.S., non-significant. Scale bar, 10 Ám. |
|
NF-κB pathway inhibition induces endocrine differentiation. (A, B) Representative confocal images - brightfield and fluorescence images merged - of dissected pancreata (dashed lines) from neurod:EGFP transgenic larvae treated from 3 to 5 dpf with NF-κB signaling inhibitor II (A) or III (B). Both inhibitors induced precocious secondary islet formation (white arrows). (C) Secondary islet numbers were quantified and plotted relative to vehicle control (0.1% DMSO). n = 5-10 larvae per condition, experiment was repeated 3 times. Error bar, standard error. All p-values were calculated using Dunnett′s test. ****p < 0.0001. (D, D′) Representative in vivo confocal z-projection of pancreas (dashed lines) in 6xNFκB:EGFP ;Tp1:hmgb1:mCherry double transgenic larvae at 5 dpf showing co-labeling of the NF-κB reporter (green) and Notch reporter (red) in endocrine progenitor cells (arrows in D′), suggesting endocrine progenitors respond to both Notch and NF-κB signaling. Scale bars, 25 Ám (D), 10 Ám (D′). EXPRESSION / LABELING:
|
|
Thioctic acid and parthenolide inhibit NF-κB signaling. (A-E) Confocal images of 5 dpf pancreata (dashed lines) from 6xNFκB:EGFP/Tp1:hmgb1-mCherry larvae treated with indicated compounds or DMSO control from 3dpf to 5dpf. The NF-κB reporter showed reduced fluorescence levels in the pancreas following exposure to all tested NF-κB inhibitors (A-D) compared with DMSO (E). Scale bar, 25 Ám. (F) ARQiv scans were performed on individually tracked 6xNFκB:EGFP/Tp1:hmgb1-mCherry larvae prior to (3 dpf) and after compound exposures (5 dpf). All compounds induced a significant reduction of NF-κB reporter activity relative to 0.1% DMSO controls. GFP reporter expression levels were normalized to pre-treatment levels - that is, plotted as percent change in fluorescence over time (as per Walker et al., 2012) - and showed significant signal loss for all tested compounds. Error bar = standard deviation. NFκBi-II: NF-κB inhibitor II, NFκBi-III: NF-κB inhibitor III. All p-values were calculated using Dunnett′s test. ***p < 0.001, ****p < 0.0001. |
|
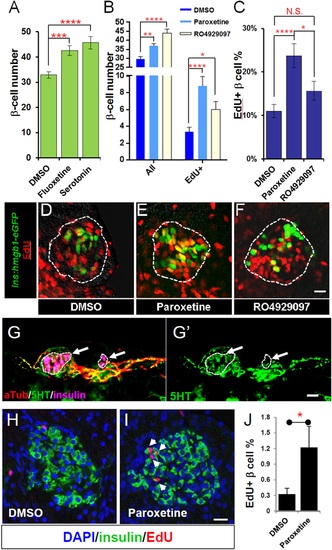
Serotonin signaling stimulates β-cell proliferation in a cell type-specific manner. (A) β-cell quantification following 25 ÁM serotonin or 25 ÁM fluoxetine treatment of ins:hmgb1-eGFP transgenic larvae from 3 to 5 dpf indicates enhanced serotonin signaling increases β-cell numbers in zebrafish larvae. (B) β-cell quantification in the principal islet (All) and the number of EdU-labeled β cells (EdU+) are plotted following treatments with EdU and either DMSO, 1 ÁM paroxetine, or 5 ÁM RO4929097. More β cells overall, and more EdU+ β cells, are observed with 1 ÁM paroxetine and 5 ÁM RO4929097 treatments, suggesting effects on β-cell proliferation. (C) Plot of EdU+ β cells as a percentage all β cells shows that paroxetine treatment stimulates β-cell proliferation, whereas Notch inhibition does not. Error bars, standard error. (D-F) Single-plane confocal fluorescence images of ins:hmgb1-eGFP islets (dashed lines) treated with EdU and either DMSO (D), 1 ÁM paroxetine (E), or 5 ÁM RO4929097 (F) - β cell nuclei (green); EdU+ cells (red); double-labled EdU+ β cells (yellow). Scale bar, 10 Ám. n = 5-10 larvae per condition, experiment was repeated 3 times. (G, G2) Confocal images of immunostained adult zebrafish pancreas indicate that serotonin signaling is active in islets (white arrows, islets indicated by dashed lines). aTub: acetylated tubulin (red); 5HT (5-hydoxytryptamine): serotonin (green); insulin (magenta). Scale bar, 10 Ám. (H, I) Confocal images of adult zebrafish pancreas following injections with EdU and either DMSO (H) or 1 mM paroxetine (I), and immunostained as indicated. (J) Plot of EdU+ β cells as a percentage all β cells shows that paroxetine treatment stimulates β-cell proliferation in adult zebrafish. Error bars, standard deviation. n = 3-5 adult fish per condition, experiment was repeated 3 times. All p-values were calculated using Dunnett′s test. *p < 0.05, **p < 0.01, ***p < 0.001, ****p < 0.0001. |

