
|
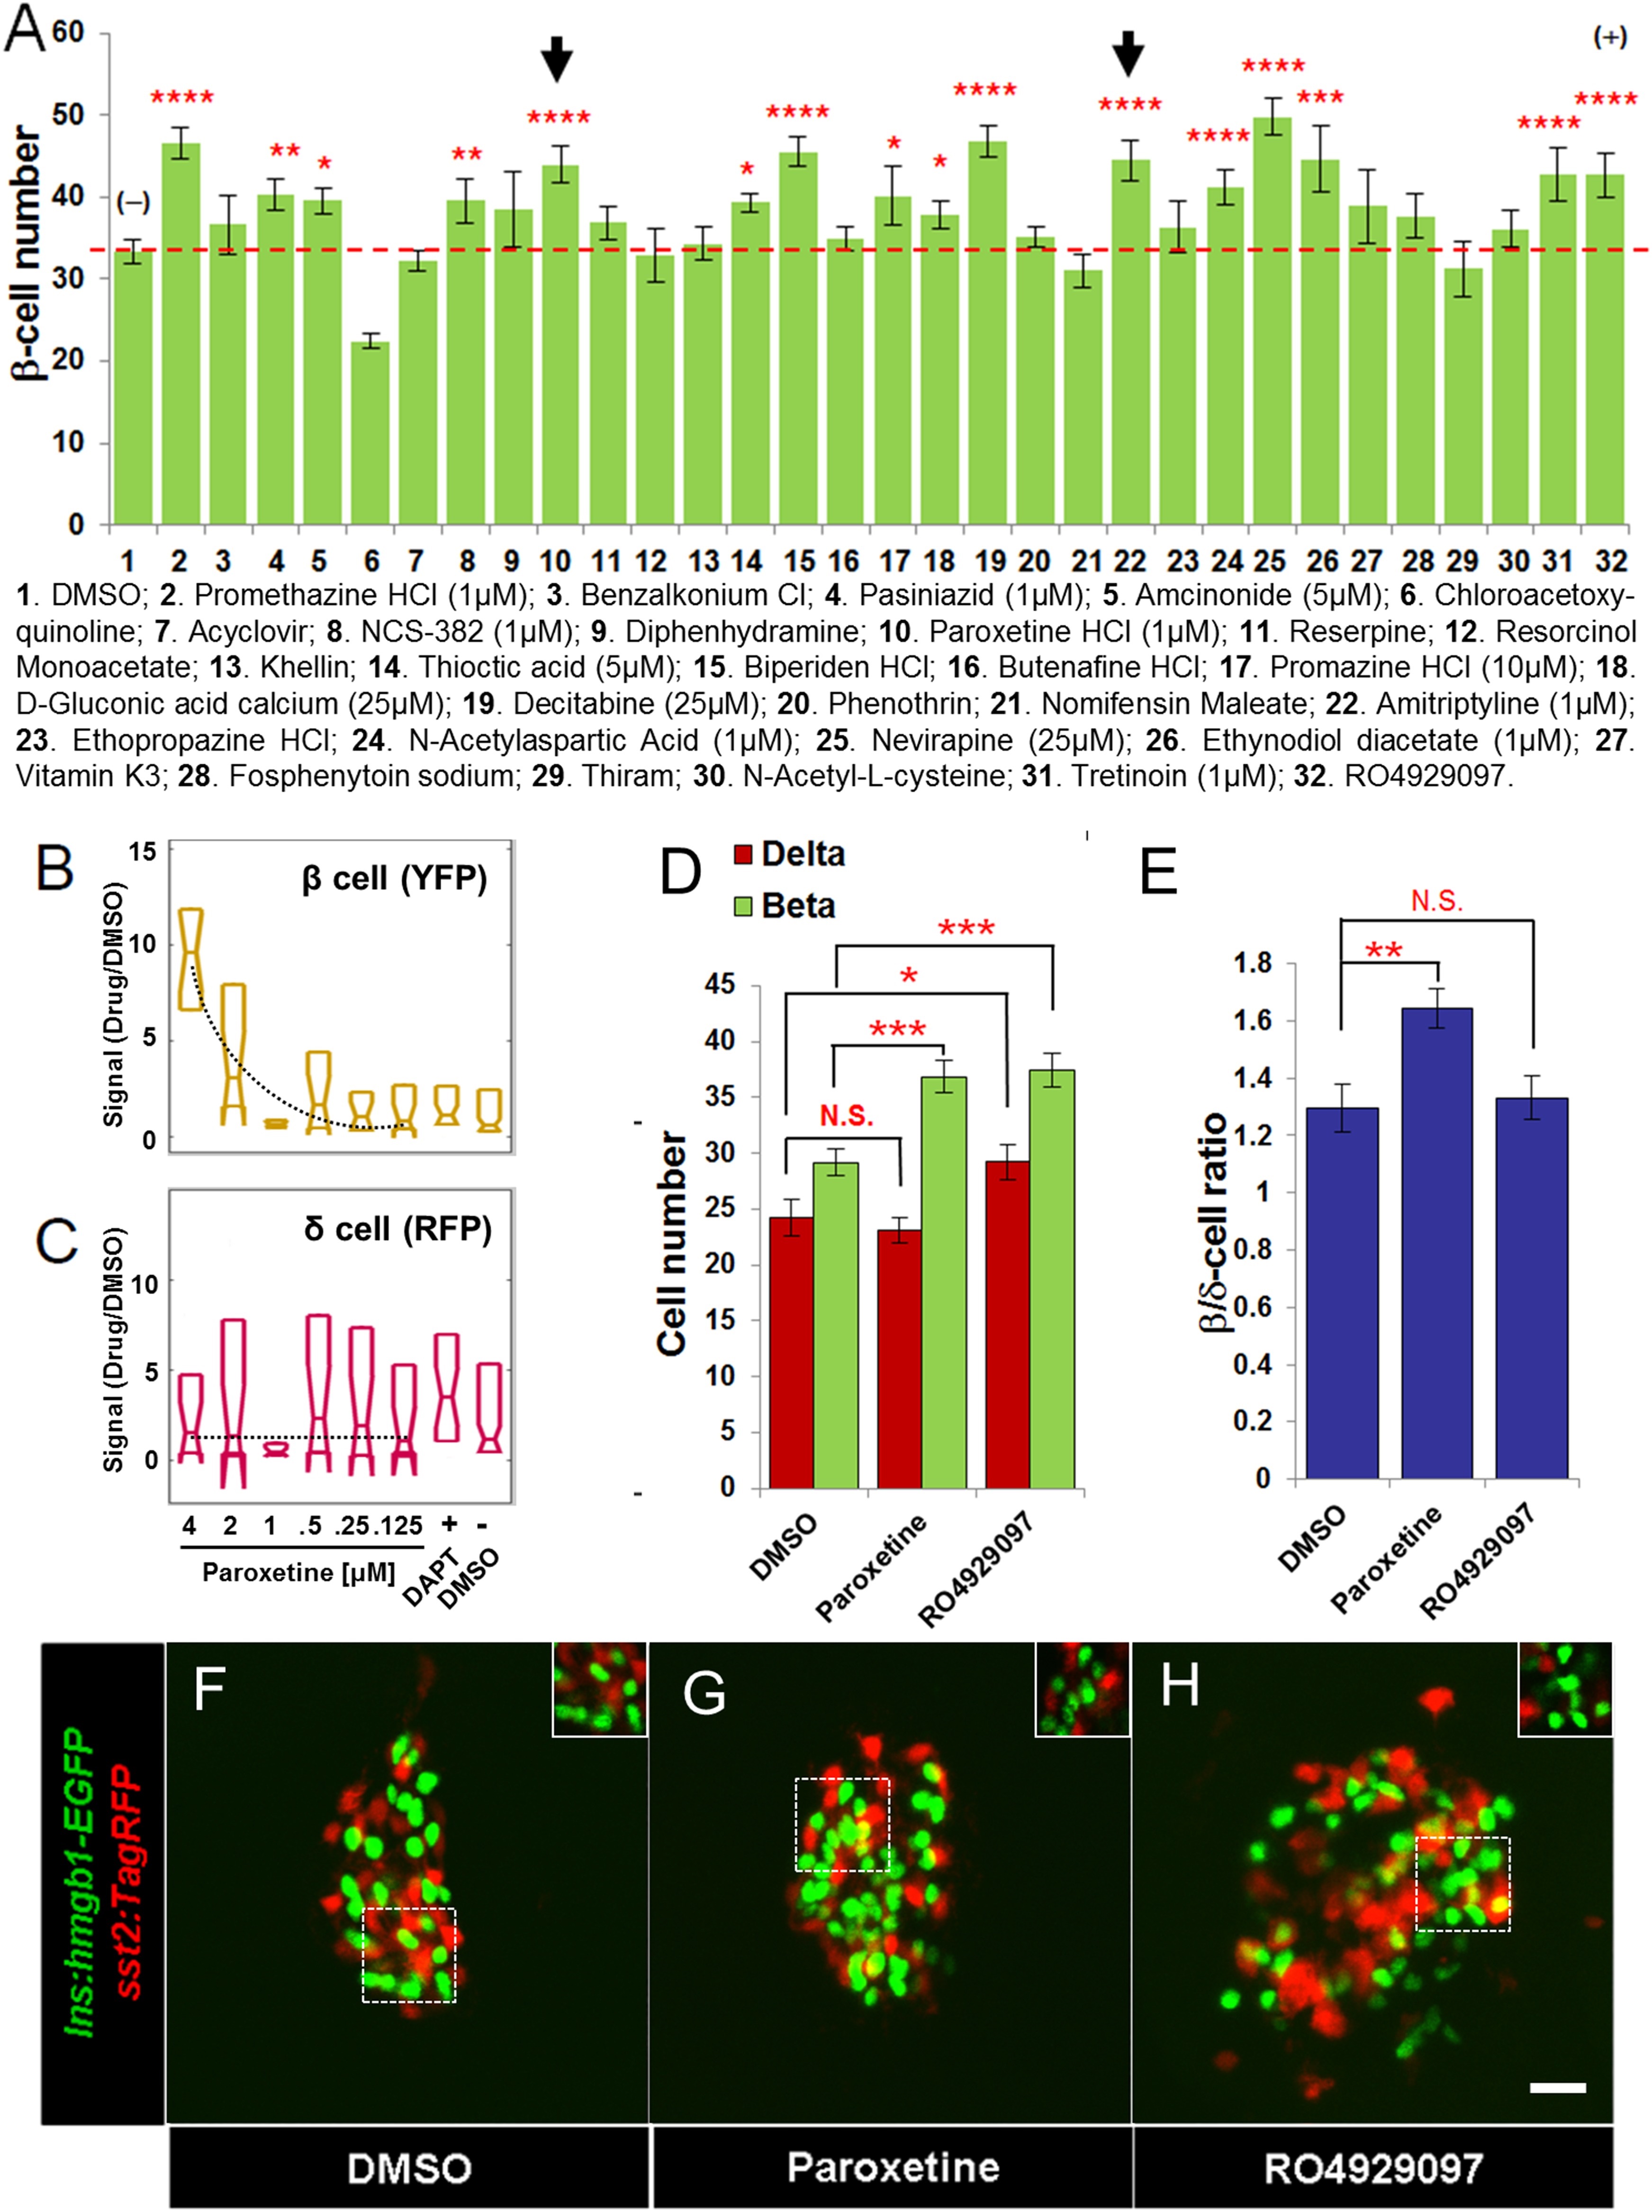
Fig. 4
Validation of increased β-cell proliferation: cell counts.
(A) Quantification of β-cell numbers following incubation of ins:hmgb1-EGFP transgenic larvae from 3 to 5 dpf in one of 30 Hit compounds, 0.1% DMSO, or the Notch inhibitor RO4929097 (5 �M). 15 compounds were confirmed as Lead II drugs for increasing β-cell numbers. Arrows indicate drugs that enhance serotonin signaling. (B, C) ARQiv screen data for paroxetine: box plots of β cells (B) and δ cells (C) suggest a β cell-specific effect - that is, a dose-response in YFP but not RFP signal (dashed line, single polynomial curve fit). (D) Numbers of δ cells (red bars) and β cells (green bars) were quantified following treatment with paroxetine, 0.1% DMSO, or RO4929097. Increased β-cell numbers were seen following paroxetine and RO4929097 treatments. However, only RO4929097 increased both β and δ cells. (E) Ratio of the number of β cells to δ cells, which confirms that the number of β cells increases following paroxetine treatment relative to δ cells, suggesting cell-type selective effects. Error bars, standard error. n = 5-10 larvae per condition, experiment was repeated 2-3 times per compound. (F-H) Representative z-projection confocal images of the principal islets in dissected pancreata (post-paraformaldehyde fixation) fromTg(ins:hmgb1-EGFP; β/δ-reporter ) triple transgenic lines treated with DMSO (F), paroxetine (G), or RO4929097 (H). Shown are EGFP+ β-cell nuclei (green) and TagRFP+ δ cells (red); note, PhiYFP in the β/δ-reporter line does not withstand fixation, allowing ?clean? labeling of β-cell nuclei with EGFP. In addition, apparent overlap between the β-cell and δ-cell markers (i.e., occasional ?yellow? cells) is an artifact of z-projection images shown in 2D format. For clarity, the inset panels show a single z-slice image of partial islet showing no co-localization of cell type specific reporters. All p-values were calculated using Dunnett′s test. *p < 0.05, **p < 0.01, ***p < 0.001, ****p < 0.0001. N.S., non-significant. Scale bar, 10 �m.