
Fig. 1
- ID
- ZDB-FIG-151016-7
- Publication
- Wang et al., 2015 - First quantitative high-throughput screen in zebrafish identifies novel pathways for increasing pancreatic β-cell mass
- Other Figures
- All Figure Page
- Back to All Figure Page
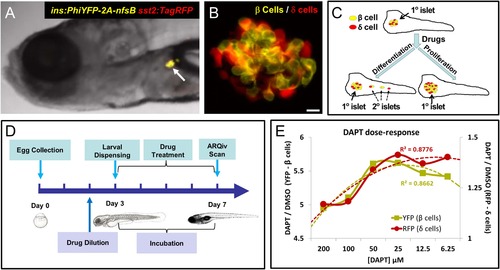
Screening resources, design, and controls. (A) Transgenic line used for the primary screen, Tg(ins:PhiYFP-2a-nsfB, sst2:tagRFP)lmc01 (β/δ reporter; Walker et al., 2012), the insulin promoter drives YFP-expression in β cells (yellow), the somatostatin 2 promoter drives RFP expression in neighboring δ cells (red). Photomicrograph of the anterior region of a 7 dpf larva shows YFP and RFP labeling of the principal islet (arrow). (B) Confocal z-projection of the principal islet in a β/δ-reporter fish (scale bar: 10 µM), YFP labeling β cells (yellow) and RFP labeling δ cells (red)-note, apparent ‘orange’ co-labeling is an artifact of z-projection in 2D format. (C) Illustration of two potential mechanisms by which drug exposures could lead to increased β-cell mass: (1) enhanced endocrine differentiation, indicated by secondary (2°) islet formation (left path) and (2) increased β-cell proliferation, indicated by supernumerary β cell numbers in the principal islet (right path) in the absence of effects on endocrine differentiation-that is, no effect on 2° islet formation. (D) Schematic of the ARQiv-HTS screening process: Day 0, mass breeding produced 5000-10,000 eggs per day; Day 2 (evening), JHDL compounds were serially diluted into drug plates; Day 3, the COPAS-XL (Union Biometrica) was used to dispense individual 3 dpf larvae into single wells of drug plates, and plates were then maintained under standard conditions for 4 days; Day 7, larvae were anesthetized and reporters quantified by automated reporter quantification in vivo (ARQiv). (E) β/δ-reporter larvae were exposed to 0.1% DMSO (negative control) or the γ-secretase/Notch inhibitor DAPT (positive control) at six different concentrations from 3 to 7 dpf. ARQiv was then used to measure fluorescent signals from β cells (yellow line, left y-axis) and δ cells (red line, right y-axis). The DAPT to DMSO ratio (DAPT/DMSO) was used to indicate signal strength for each fluorophore independently, as per the primary screen. The β-cell data show a non-monotonic dose response (yellow dashed line, polynomial curve fit), with maximal signal observed at 25-50 µM DAPT. The δ-cell data show a similar trend (red dashed line, polynomial curve fit), but with approximately fourfold lower signal strength due to higher autofluorescent background in the RFP emission range. |
| Genes: | |
|---|---|
| Fish: | |
| Anatomical Terms: | |
| Stage: | Days 7-13 |