- Title
-
Ccdc94 Protects Cells from Ionizing Radiation by Inhibiting the Expression of p53
- Authors
- Sorrells, S., Carbonneau, S., Harrington, E., Chen, A.T., Hast, B., Milash, B., Pyati, U., Major, M.B., Zhou, Y., Zon, L.I., Stewart, R.A., Look, A.T., and Jette, C.
- Source
- Full text @ PLoS Genet.
|
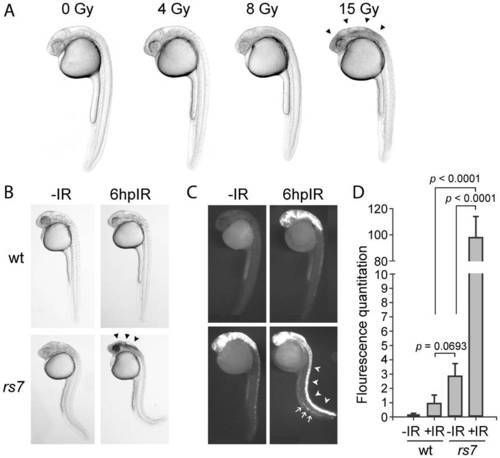
Identification of radiosensitizing mutation #7. (A) Wild-type AB strain embryos were exposed to the indicated amount of IR at 24 hpf and visualized by brightfield microscopy 6 hours later. A threshold of IR exists between 8 and 15 Gy that gives rise to obvious cell death (seen as opaque tissue, marked by arrowheads) in the brain. (B) Wild-type embryos (derived from crossing wild-type parents) or rs7 mutant embryos (derived from crossing rs7 heterozygous parents) were exposed to 8 Gy IR at 24 hpf and visualized by brightfield microscopy 6 hours later. Arrowheads in the rs7 mutant mark cell death reminiscent of exposure of wild-type embryos to 15 Gy (as shown in A) (C) Embryos in (B) were sorted by phenotype, fixed at 6 hpIR and analyzed by immunofluorescence to detect activated Caspase-3. The ?curly-up? tail phenotype and opaque tissue in the head were used to identify rs7 mutants. These phenotypes are present (to different degrees of severity) in both unirradiated and irradiated mutants such that they can be readily distinguished from siblings and wild-type at 30 hpf. After fixation of mutants, tails were clipped to distinguish them from wild-type embryos, which were analyzed in the same tube for Caspase-3 activity. Embryos were grouped for analysis according to whether embryos were irradiated or not, and rs7 mutants were identified based on the presence of tail-clips. Arrowheads point to the enhanced apoptosis in the spinal cord of an rs7 mutant, and arrows point to increased apoptosis in the ICM region of an rs7 mutant. (D) Immunofluorescence in the spinal cords from at least 10 embryos per group in (C) was quantified. wt; wild-type. See also. PHENOTYPE:
|
|
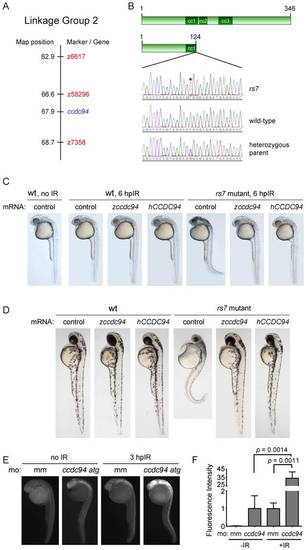
The rs7 phenotype is caused by a mutation in the ccdc94 gene. (A) The rs7 mutation was localized to a 2.1 cM region (compared to the Massachusetts General Hospital genetic map for linkage group 2) as defined by flanking markers z58296 and z7358. (B) Sequencing of candidate genes (based on gene expression profiles) revealed a premature stop codon in the ccdc94 gene. Sequence from the ccdc94 gene exon 4 is shown for an rs7 mutant, an unrelated wild-type AB embryo, and a heterozygous parent of the rs7 mutant. Asterisk indicates the rs7 point mutation, and box illustrates mutation to a TGA nonsense codon. (C) Wild-type AB strain or rs7 heterozygous fish were incrossed, and the progeny were injected with mRNA encoding the indicated genes at the one-cell stage of development. At 24 hpf, embryos were exposed to 8 Gy IR and visualized by brightfield microscopy 6 hours later. (D) Embryos were injected similar to (C) but were not irradiated. Instead, they were left to develop until 48 hpf. (C and D) Because rs7 mutant and sibling embryos injected with wild-type ccdc94 mRNAs were morphologically indistinguishable, pictures were taken first, and the embryos were subsequently genotyped to identify mutants. (E) Wild-type embryos were injected with 400 μM mismatch morpholino (mm) as a negative control, or a translation-blocking ccdc94 morpholino (ccdc94 atg). Embryos were then irradiated at 24 hpf with 8 Gy IR and analyzed three hours later by immunofluorescence to detect activated Caspase-3. (F) Embryos in (E) were quantified similar to Figure 1D. Comparisons between mismatch morpholino-injected embryos plus and minus IR generated a p value of 0.0114. See also S3. PHENOTYPE:
|
|
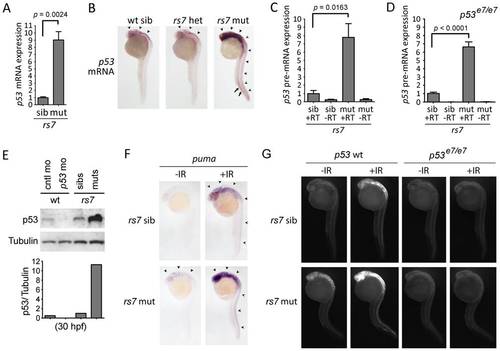
The rs7-mediated radiosensitizing phenotype is caused by an increase in p53 mRNA expression. |
|
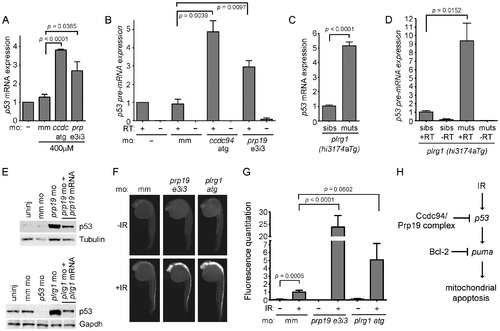
Loss of prp19 or plrg1 phenocopies, loss of ccdc94. (A) Wild-type embryos were injected with the indicated morpholinos. RNA was harvested at 30 hpf, reverse transcribed using oligo-dT primers and analyzed for the expression of p53 mRNA by qPCR. Expression of the gapdh gene was also analyzed to normalize p53 mRNA levels. All values were then compared to the average value from uninjected embryos, which was adjusted to one. (B) RNA from (A) was reverse transcribed with random hexamers, and intron 9 of the p53 gene was analyzed by qPCR to determine levels of p53 pre-mRNA. Expression of 28S RNA was also analyzed to normalize p53 pre-mRNA levels. All values were then compared to the average value from uninjected embryos, which was adjusted to one. (C, D) Siblings and mutants from the plrg1(hi3174aTg) line were distinguished by morphology at 30 hpf and collected for analysis. RNA was harvested and analyzed by qPCR as in (A, B). For panels (A?D), error bars represent the standard error of the mean from at least three independent experiments. (E) Wild-type embryos were injected with the indicated morpholinos and analyzed at 30 hpf for p53 protein similar to Figure 3E. (F) Wild-type embryos were injected with the indicated morpholinos, irradiated (or not) at 24 hpf with 8 Gy and analyzed three hours later by whole-mount immunofluorescence to detect activated Caspase-3. Three independent experiments showed that knockdown of prp19 or plrg1 radiosensitized the embryos. (G) Activated-Caspase-3-specific immunofluorescence from (F) was quantified as in Figure 1D. (H) Genetic diagram showing that the Ccdc94 and core members of the Prp19 complex inhibit the transcription of p53, and therefore p53-mediated induction of puma expression, and normally restrict IR-induced mitochondrial apoptosis, upstream of Bcl-2. For all relevant panels in this figure, morpholinos were injected at the same concentrations as described in Figure 4B-4D. RT; reverse transcriptase, mm; mismatch, ccdc; ccdc94, prp; prp19. See also Figure S8. PHENOTYPE:
|
|
Loss of prp19 or plrg1 phenocopies, loss of ccdc94. (A) Wild-type embryos were injected with the indicated morpholinos. RNA was harvested at 30 hpf, reverse transcribed using oligo-dT primers and analyzed for the expression of p53 mRNA by qPCR. Expression of the gapdh gene was also analyzed to normalize p53 mRNA levels. All values were then compared to the average value from uninjected embryos, which was adjusted to one. (B) RNA from (A) was reverse transcribed with random hexamers, and intron 9 of the p53 gene was analyzed by qPCR to determine levels of p53 pre-mRNA. Expression of 28S RNA was also analyzed to normalize p53 pre-mRNA levels. All values were then compared to the average value from uninjected embryos, which was adjusted to one. (C, D) Siblings and mutants from the plrg1(hi3174aTg) line were distinguished by morphology at 30 hpf and collected for analysis. RNA was harvested and analyzed by qPCR as in (A, B). For panels (A?D), error bars represent the standard error of the mean from at least three independent experiments. (E) Wild-type embryos were injected with the indicated morpholinos and analyzed at 30 hpf for p53 protein similar to Figure 3E. (F) Wild-type embryos were injected with the indicated morpholinos, irradiated (or not) at 24 hpf with 8 Gy and analyzed three hours later by whole-mount immunofluorescence to detect activated Caspase-3. Three independent experiments showed that knockdown of prp19 or plrg1 radiosensitized the embryos. (G) Activated-Caspase-3-specific immunofluorescence from (F) was quantified as in Figure 1D. (H) Genetic diagram showing that the Ccdc94 and core members of the Prp19 complex inhibit the transcription of p53, and therefore p53-mediated induction of puma expression, and normally restrict IR-induced mitochondrial apoptosis, upstream of Bcl-2. For all relevant panels in this figure, morpholinos were injected at the same concentrations as described in Figure 4B-4D. RT; reverse transcriptase, mm; mismatch, ccdc; ccdc94, prp; prp19. See also Figure S8 |
|
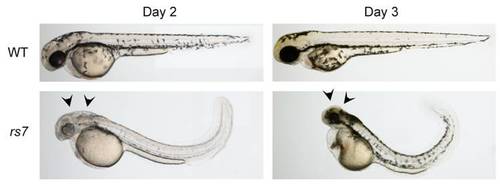
The rs7 mutation causes severe neurodegeneration that culminates in embryonic lethality. Wild-type embryos (derived from wild-type parents) and rs7 mutants were analyzed by brightfield microscopy on day 2 and day 3 of development. The rs7 mutation causes massive accumulation of cell death in the brain and spinal cord likely contributing to a small-head and ?curly-up? tail phenotype. Rs7 mutant embryos usually fail to survive past day three. PHENOTYPE:
|
|
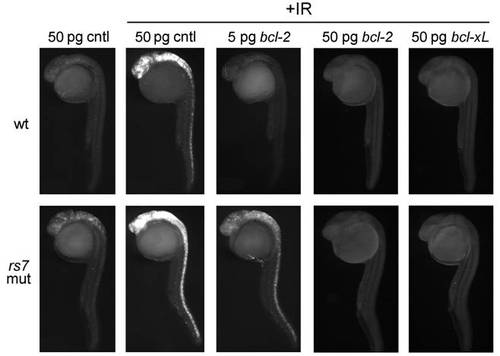
Loss of ccdc94 compromises the anti-apoptotic function of Bcl-2. Wild-type (wt, derived from crossing wild-type parents) or rs7 mutant embryos (derived from crossing rs7 heterozygous parents) were injected at the one-cell stage of development with the indicated amounts of mRNA encoding zbcl-2, zbcl-xL, or egfp as a control (cntl). Embryos were then irradiated at 24 hpf with 8 Gy IR and analyzed three hours later by immunofluorescence to detect activated Caspase-3. Mutants were genotyped as in Figure 2C?2D. Representative data from three independent experiments is shown. |
|
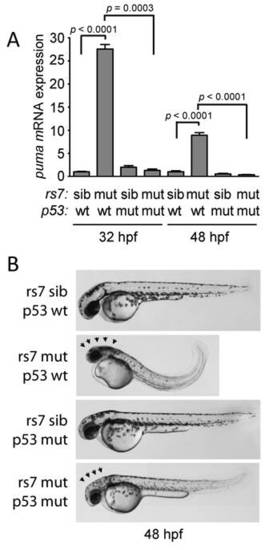
p53-mediated puma expression causes neurodegeneration in rs7 mutants. (A) rs7 sibling or mutant embryos in the p53 wild-type or mutant background were collected, and RNA was harvested at 30 hpf, reverse transcribed and analyzed for the expression of puma mRNA by qPCR. Rs7 mutants and siblings were distinguished by morphology since loss of p53 does not inhibit the rs7-mediated ?curly-up? tail phenotype. (B) Pictures were taken of 48 hpf embryos from (A). Arrows point to neurodegeneration in rs7 mutants that is substantially rescued by loss of wild-type p53. For panel (A), error bars represent the standard error from three independent experiments. PHENOTYPE:
|
|
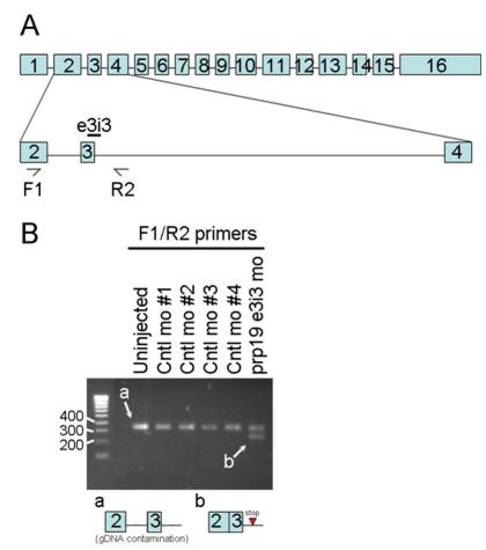
The prp19 morpholino inhibits proper splicing of the prp19 pre-mRNA transcript. (A) Schematic of the zebrafish prp19 gene with exons shown as boxes and introns shown as lines between boxes. The e3i3 morpholino targets the splice donor site at the border of exon 3 and intron 3. In (B), F1 and R2 primer-based PCR will amplify from exon 2 to intron 3. Properly spliced mRNA should not give rise to PCR product. Inclusion of intron 3 should give rise to a 245-basepair product. (B) RNA from embryos injected with mismatch morpholino controls or prp19 e3i3 morpholino was harvested at 24 hpf, reverse transcribed with oligo-dT primers, and analyzed by PCR using primers shown in (A). Bands were excised from the gel, cloned into pGEM-T-Easy, and sequenced. Lower-case letters point to bands on the gel which correspond to regions of the prp19 gene shown below. When embryos were injected with the e3i3 morpholino, F1/R2 primers gave rise to a band representing inclusion of intron 3 (b). This should cause premature termination the Prp19 protein since a stop codon is present in the middle of the intron. Unexpectedly, all samples gave rise to a 330-basepair band (a) which is likely derived from the presence of contaminating genomic DNA but does not change interpretation of the data. |
|
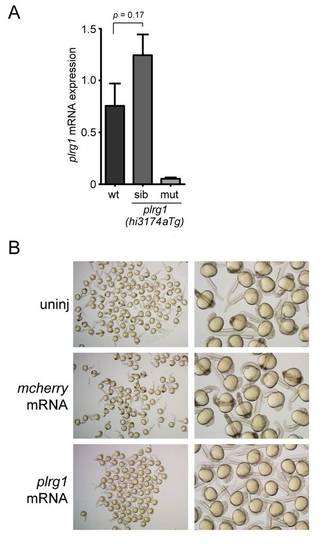
Loss of plrg1 mRNA expression in the plrg1(hi3174aTg) line leads to severe developmental abnormalities characterized by excessive cell death. (A) Siblings and mutants were collected from the plrg1(hi3174aTg) line based on morphology. RNA was harvested from each group at 30 hpf, reverse transcribed and analyzed by qPCR to determine levels of plrg1 mRNA. Error bars represent the standard error from three independent experiments. (B) plrg1(hi3174aTg) heterozygous fish were incrossed, and the progeny were either left uninjected or injected with 100 ng/uL of the indicated mRNAs. Right panels show higher magnification of embryos from adjacent left panels. Overexpression of plrg1 rescues the developmental abnormalities in the plrg1(hi3174aTg) mutants. |

