IMAGE

Fig. 3

ID
ZDB-IMAGE-120918-2
Genes
Antibodies
Source
Figures for Sorrells et al., 2012
Image
Figure Caption

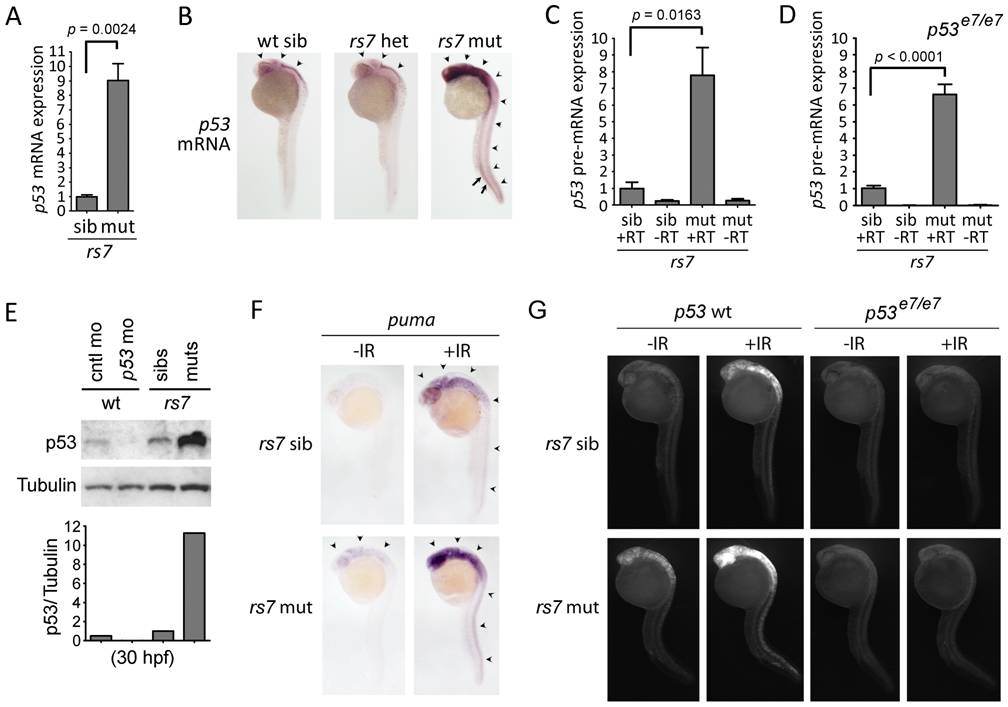
Fig. 3 The rs7-mediated radiosensitizing phenotype is caused by an increase in p53 mRNA expression.

rs7 siblings and mutants were identified based on morphology (similar to 1C). RNA was isolated, reverse transcribed using oligo-dT primers and analyzed for the expression of p53 mRNA by qPCR. Expression of the gapdh gene was also analyzed to normalize p53 mRNA levels. All data was then compared to sibling data, which was adjusted to a value of one. (B) rs7 siblings and mutants were grown to 24 hpf and analyzed by whole-mount in situ hybridization with a probe complementary to p53 mRNA. High levels of p53 mRNA expression are evident in neural tissue (arrowheads) and the ICM (arrows). Pictures were taken first, and the embryos were subsequently genotyped to identify mutants and heterozygous or wild-type siblings. (C) RNA from (A) was reverse transcribed with random hexamers, and intron 9 of the p53 gene was analyzed by qPCR to determine levels of p53 pre-mRNA. Expression of 28S RNA was also analyzed to normalize p53 pre-mRNA levels. Similar results were obtained from an analysis of intron 4 (data not shown). All data was then compared to sibling data, which was adjusted to a value of one. (D) rs7+/-;p53e7/e7 fish were incrossed to analyze rs7 siblings and mutants in a p53 homozygous mutant background. Rs7 mutants and siblings were distinguished by morphology since loss of p53 does not prevent the rs7-mediated “curly-up” tail phenotype. RNA was harvested at 30 hpf and analyzed as in (C). (E) Protein was harvested from rs7 siblings and mutants, and p53 and control morphants (injected at 400 µM) at 30 hpf and analyzed for p53 and Tubulin (as a loading control). ImageJ software was used to quantify band intensity from film. Shown below the blot are values for p53 divided by values for Tubulin (corresponding to above lanes) with rs7 siblings normalized to one. (F) rs7 sibling or mutant embryos were irradiated at 24 hpf with 8 Gy IR and analyzed 2 h later by whole-mount in situ hybridization with a probe complementary to puma mRNA. Arrowheads point to puma expression in neural tissue. (G) rs7 sibling or mutant embryos in the p53 wild-type or homozygous mutant background were irradiated at 24 hpf with 8 Gy IR and analyzed three hours later by immunofluorescence to detect activated Caspase-3. For panels (A), (C), and (D), error bars represent the standard error of the mean from at least three independent experiments. Panels (B) and (F–G) show representative data from at least three independent experiments. RT; reverse transcriptase. See also Figures S4, S5, S6.

Figure Data
Acknowledgments
This image is the copyrighted work of the attributed author or publisher, and ZFIN has permission only to display this image to its users. Additional permissions should be obtained from the applicable author or publisher of the image. Full text @ PLoS Genet.