- Title
-
A reporter-assisted mutagenesis screen using ?1-tubulin-GFP transgenic zebrafish uncovers missteps during neuronal development and axonogenesis
- Authors
- Gulati-Leekha, A., and Goldman, D.
- Source
- Full text @ Dev. Biol.
|
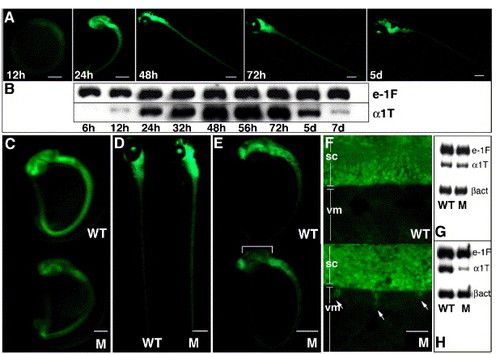
A two-step screening protocol following mutagenesis of α1-T-GFP transgenic zebrafish identifies concomitant defects in GFP and α1-tubulin expression. Visual examination of GFP fluorescence in nonmutagenized transgenic embryos during first week of development (A) and semiquantitative RT-PCR for α1-tubulin (α1T) transcription during the same time period (B). e-1F4α (e-1F) transcript is used as the normalizing control. Note that GFP fluorescence (obscured to some extent by pigment cells) persists robustly at 5 dpf whereas a perceptible down-regulation of α1-tubulin mRNA begins at this time, diminishing to very low levels by 7 dpf. Panels C–F show representative GFP phenotypes of mutants (M) isolated in the primary visual screen: (C) panneural decrease and (D) panneural increase when compared with age-matched wild-type (WT) siblings; (E) localized decrease in mid-brain whereas fluorescence in other CNS regions only mildly affected; (F) ectopic GFP-positive projections (arrows) from the spinal cord (SC) into ventral myotome (VM). Panels G and H show representative RNA profiles of two mutants (displaying panneural GFP reduction at 1dpf), analyzed using the secondary RT-PCR screen. RT-PCR using age-matched wild-type and mutant embryos at 27 hpf (G) and 32 hpf (H) were carried out. Upon normalization with e-1F4α and β-actin (βact), reduction in α1-tubulin mRNA is observed only in panel H; hence, the corresponding mutant is selected for further characterization. Mutant in panel G is discarded as a possible housekeeping gene defect. Scale bars: 25 μm in panel F, 250 μm in all other figures. |
|
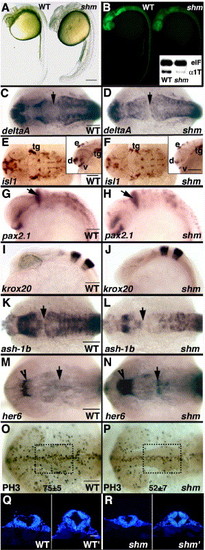
sookshma, a low GFP mutant displays fewer neural precursors caused by a cell proliferation deficit whereas neural patterning remains unperturbed. Bright-field (A) and fluorescent (B) images of live, 28 hpf wild-type (WT) and sookshma (shm) embryos. Inset in panel B shows the corresponding RT-PCR profile at 32 hpf for endogenous α1-tubulin (α1T) and e-1F4α (e1F) control transcripts. Expression analysis of neurogenesis and neural patterning markers at 28 hpf by ISH (C–J). deltaA expression shows that the neuronal (progenitor + postmitotic cell) population in mutants is severely compromised (C and D), islet-1-positive postmitotic neuronal clusters are slightly reduced in the HB (E and F) with more perceptible decrease in FB (insets, E and F) whereas MB-HB boundary (pax2.1; G and H) and rhombomeric segments (krox-20; I and J) are completely unaffected. Decrease in neural precursors, evident at 22 hpf by weaker ash-1b expression (K and L), is not completely attributable to her6 de-repression, which is significantly expanded only in the FB-anterior MB domain (arrowhead; M and N) accompanied by a modest increase at the MB-HB boundary (arrow; M and N). Instead, shm embryos harbor fewer PH3-positive mitotic figures at 19.5 hpf causing a reduction in α1-tubulin/GFP-expressing neural precursors (O and P). Mitotic cells in the outlined area were counted (75.3 ± 5.1 in WT, n = 4; 52.4 ± 6.6 in shm, n = 4). Proliferation defect leads to a thinner mutant neural tube with fewer cells (Q and R). Images show DAPI-stained transverse sections at the widest part of the HB (WT, shm) and MB ventricles (WT', shm') in both wild-type and mutant neural tubes. Total cell counts at MB level: 329.2 ± 17.2 cells/section (WT, n = 2) and 244.7 ± 29.1 cells/section (shm, n = 3). Panels A and B, insets in E and F, and G–J are all lateral views; panels C–F, K–P are dorsal views. Anterior is towards left in all whole-embryo images. Arrows present a reference point by marking the MB-HB boundary. Scale bars: 250 μm in panels A and B, 50 μm in panels Q and R, 100 μm in all other images. tg, trigeminal ganglia; v, ventrorostral cluster; d, dorsorostral cluster; e, epiphyseal cluster. EXPRESSION / LABELING:
|
|
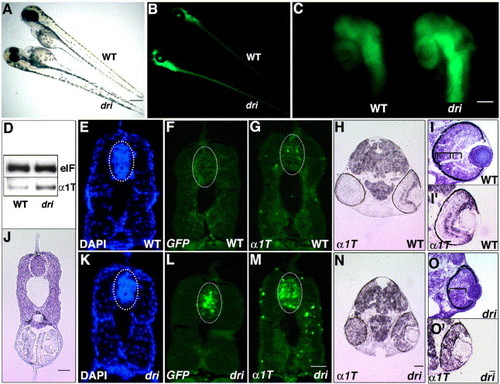
Mutation in drishti increases GFP and α1-tubulin mRNA in the developing CNS. Bright-field (A) and fluorescent (B) images of dri mutant and a sibling at 3 dpf. Note the panneurally increased GFP expression and reduced eye size. Mutant retinas display a significant increase in fluorescence, clearly visible in PTU-treated embryos (C). RT-PCR at 2 dpf confirms a concomitant increase in α1-tubulin (α1T) mRNA, e-1F4α (e1F) is the normalizing control (D). Transverse sections of 2-day-old embryos show that the dri spinal cord has slightly reduced cell number, 107 ± 8, n = 3, in wild-type and 83 ± 11.3, n = 3, in mutants (DAPI staining, E and K); however, ISH analysis using a GFP (fluorescein-labeled) riboprobe (F and L) and α1-tubulin (fluorescein-labeled) riboprobe (G and M) demonstrate that these transcripts are remarkably higher in mutants (panel J shows a cresyl violet-stained representative section for the spinal cord level at which above analysis was performed). A similar increase in mRNA expression is observed in dri brain at 2 dpf (panels H and N, α1-tubulin ISH using a digoxigenin-labeled riboprobe; GFP ISH not shown). dri retina at 2 dpf lacks the typical laminar organization of its wild-type counterpart (cresyl violet staining, panels I and O) and expresses α1-tubulin at a uniformly high level (digoxigenin-labeled α1T riboprobe, panels I′ and O′) whereas the strongest expression in WT retina is restricted to the GCL (and central INL). Ellipses (E–G, J–M) outline the spinal cord region in which total cell counts were performed. Scale bars: 250 μm in panels A and B; 100 μm in panel C; and 25 μm in panels J, M (for E–G and K–M), N (for H,N) and O′ (for I, I′, O and O′). EXPRESSION / LABELING:
|
|
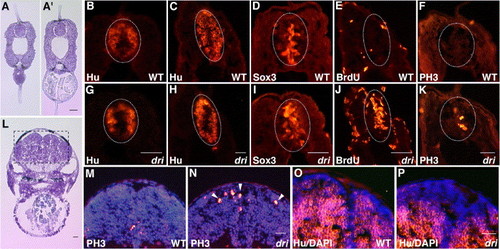
Mutation in drishti biases the neuronal composition towards proliferating progenitors at the expense of postmitotic cells. Panels A and A′ indicate the anteroposterior level of the embryo at which spinal cord analysis was carried out. HuC/D immunostaining of caudal (A, B, G) and mid-trunk (A′, C, H) transverse spinal cord sections shows a reduction in Hu-positive neurons at 2 dpf. Increase in Sox3 (D, I), BrdU (E, J), and PH3 (F, K) immunostaining in similar sections (mid-trunk level, A′) demonstrates that the self-renewing neural population in mutants is enriched by an enhanced number of cycling cells. Note that whereas the majority of increase in BrdU incorporation is restricted to neural cells, some evidence of higher staining is also observed in the dri surface epithelium (J). Representative transverse sections of the hind-brain ventricular region (outlined area, L) show a concomitant enrichment of PH3-positive cells (arrowheads) in dri mutants [panels M and N show DAPI-stained images (blue) overlaid with the corresponding PH3 immunostaining (red)]. Hu (red) and counter-stained DAPI (blue) merged images in O and P highlight the diminished Hu-positive domain surrounding the HB ventricle in dri. Ellipses mark the spinal cord in panels A–K. Scale bars: 25 μm in all panels. EXPRESSION / LABELING:
|
|
The dri retina is enriched for proliferating retinoblasts, which when unable to withdraw from the cell cycle, undergo premature death. DAPI-stained retinal sections at 3 dpf illustrate the loss of lamination in dri mutants (A, I). Bracketed regions mark the three cellular and two plexiform layers in wild-type retinas replaced by a contiguous neuroepithelial structure. Panels B and J show the localization of BrdU-positive cells in the CGZ of wild-type retinas at 2 dpf whereas a majority of cells in mutant retina are cycling. Albeit restricted to retinal periphery, an expanded S-phase cycling population is still maintained in mutant retinas at 3 dpf (C, K). Arrowheads indicate an accompanying abundance of PH3-positive mitotic figures at 2 dpf (D, L) and 3 dpf (E, M). Developmental progression of retinoblasts to Hu-positive postmitotic cells is severely impaired at 2 dpf, partial recovery observed at 4 dpf with signs of primitive lamination (F, N; G, O, brackets). Excess cells are eliminated by apoptosis in 2-day-old dri retinas illustrated by cleaved-caspase-3 (casp) immunostaining (H, P). Cell death is very rarely detected at later time points examined. Scale bars: 25 μm in all panels. |
|
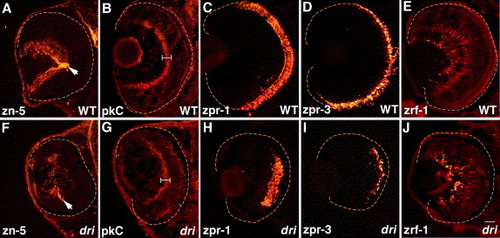
drishti does not affect retinal cell type specification, migration, or terminal differentiation. Retinal sections immunostained with zn-5 (RGCs and optic nerve (arrow) at 3 dpf; A, F); protein kinase C (pkC, bipolar cells and their processes at 4 dpf; (B, G) brackets indicate the strongly staining inner plexiform layer); Fret43 (zpr-1) (double-cone photoreceptors at 5 dpf; C, H); Fret11 (zpr-3) (rod photoreceptors at 5 dpf; D, I); and zrf-1 (Muller glia at 5 dpf; E, J). All cell types examined are present (in reduced numbers) in dri retinas at their expected radial positions and have normal cellular morphologies. Scale bar: 25 μm in panel J for all images. EXPRESSION / LABELING:
|
|
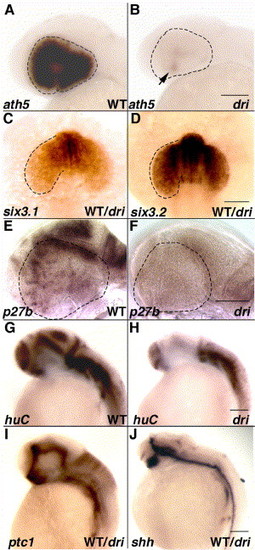
Mutation in drishti causes an early cell cycle block, which portends the later neurogenesis defects. ISH carried out in phenotypically normal embryos, 25% of which show visibly reduced ath5 expression except in the ventronasal patch (arrow; panels A and B). Prior to this defect, six3 regulation is unperturbed at the 15-somite stage (C, D). Panels E and F highlight an accompanying decrease in the cell cycle marker, p27b, at 34 hpf. At the same time, fewer postmitotic Hu-positive neurons are observed in the developing CNS (G, H). Expression of patched1 (ptc1), an indicator of Hh signaling as well as sonic hedgehog (shh), is indistinguishable in a pool of 34 hpf embryos (I, J). All images show lateral views of embryos with anterior towards left except C and D (dorsal views with anterior towards top). Scale bars: 100 μm in all panels. EXPRESSION / LABELING:
|
|
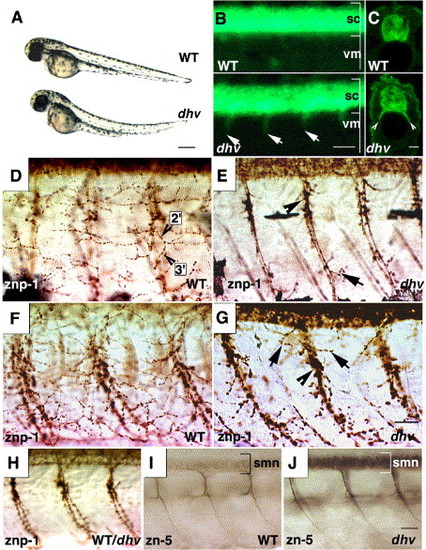
Motoxonal branching and terminal innervation is impaired in the dhv spinal cord. Mutants become discernible at 2 dpf displaying progressive paralysis and other dysmorphologies (bright-field images showing lateral view of embryos (A) accompanied by fluorescent ventral projections (arrows; B) from the spinal cord (sc, lateral view, anterior towards left) into the ventral myotome (vm). GFP immunostaining of transverse spinal cord sections further highlights the GFP-positive spinal nerves (arrowheads, C). znp-1 immunostaining of caudal (D, E) and rostral (F, G) myotomal segments at 57 hpf shows lack of secondary and tertiary (2′,3′; D) motoaxonal branches in dhv. Note the stunted lateral projections (arrows; panels E and G) and swollen varicosities (arrowheads; panels E and G). Intense staining of spinal cord precludes examination of dorsal myotome. Motor axonal pathfinding is indistinguishable between mutant and wild-type spinal cords at 32 hpf (representative znp-1 immunostaining; H). Mutation in dhruva forestalls down-regulation of DM-GRASP expression, which marks secondary motor neurons (smn) and corresponding fasciculated axonal segments (zn-5 immunostaining at 57 hpf, representative mid-trunk spinal cord segments; panels I and J). Scale bars: 250 μm in panel A, 50 μm in panel B, 25 μm in panels C, D–G, and H–J. EXPRESSION / LABELING:
|
|
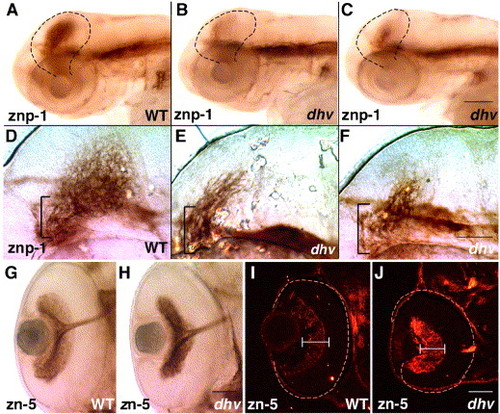
Mutation in dhruva disrupts the retinotectal architecture without affecting RGC differentiation and optic nerve formation. znp-1 immunostaining of 3-day-old embryos highlights tectal innervation, which is dramatically reduced in mutants (A–C). Higher magnification images indicate unbranched (E) or stalled retinal axons (F) in mutant tecta whereas the wild-type tectum displays an intricate arborization pattern (D). Brackets mark the fasciculated segments of the optic tract as it approaches the tectum. Immunostaining using zn-5 antibody in panels G and H confirms that RGCs elaborate axons and form a normal optic tract in dhv mutants at 57 hpf. Subsequently, impaired arborization and innervation probably leads to loss of DM-GRASP down-regulation in 3-day-old dhv retinas (zn-5 immunostaining of retinal sections; I, J). All images are oriented such that anterior is towards left. Scale bar: 100 μm in panels A–C, 50 μm in panels D–F, G and H, and I and J. EXPRESSION / LABELING:
|
Reprinted from Developmental Biology, 296(1), Gulati-Leekha, A., and Goldman, D., A reporter-assisted mutagenesis screen using ?1-tubulin-GFP transgenic zebrafish uncovers missteps during neuronal development and axonogenesis, 29-47, Copyright (2006) with permission from Elsevier. Full text @ Dev. Biol.

