
|
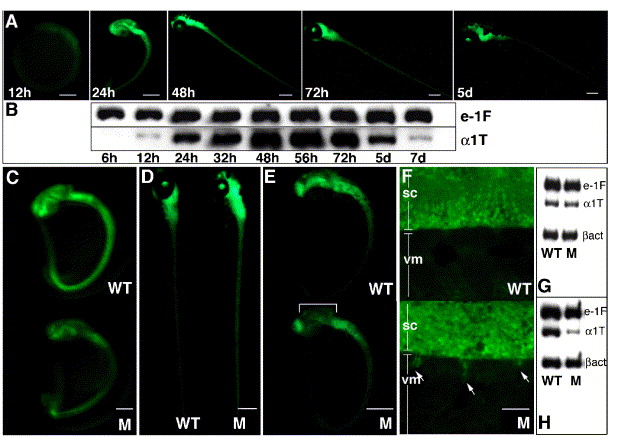
Fig. 1 A two-step screening protocol following mutagenesis of α1-T-GFP transgenic zebrafish identifies concomitant defects in GFP and α1-tubulin expression. Visual examination of GFP fluorescence in nonmutagenized transgenic embryos during first week of development (A) and semiquantitative RT-PCR for α1-tubulin (α1T) transcription during the same time period (B). e-1F4α (e-1F) transcript is used as the normalizing control. Note that GFP fluorescence (obscured to some extent by pigment cells) persists robustly at 5 dpf whereas a perceptible down-regulation of α1-tubulin mRNA begins at this time, diminishing to very low levels by 7 dpf. Panels C–F show representative GFP phenotypes of mutants (M) isolated in the primary visual screen: (C) panneural decrease and (D) panneural increase when compared with age-matched wild-type (WT) siblings; (E) localized decrease in mid-brain whereas fluorescence in other CNS regions only mildly affected; (F) ectopic GFP-positive projections (arrows) from the spinal cord (SC) into ventral myotome (VM). Panels G and H show representative RNA profiles of two mutants (displaying panneural GFP reduction at 1dpf), analyzed using the secondary RT-PCR screen. RT-PCR using age-matched wild-type and mutant embryos at 27 hpf (G) and 32 hpf (H) were carried out. Upon normalization with e-1F4α and β-actin (βact), reduction in α1-tubulin mRNA is observed only in panel H; hence, the corresponding mutant is selected for further characterization. Mutant in panel G is discarded as a possible housekeeping gene defect. Scale bars: 25 μm in panel F, 250 μm in all other figures.
Reprinted from Developmental Biology, 296(1), Gulati-Leekha, A., and Goldman, D., A reporter-assisted mutagenesis screen using α1-tubulin-GFP transgenic zebrafish uncovers missteps during neuronal development and axonogenesis, 29-47, Copyright (2006) with permission from Elsevier. Full text @ Dev. Biol.