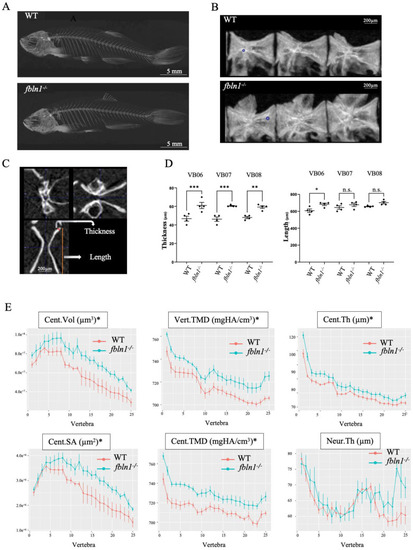
fbln1−/− adult zebrafish exhibit increased vertebral TMD and vertebral thickness. (A) µCT scans (MIPi = Maximum Intensity Projected image) of 1 year old adult WT and mutants. fbln1−/− larvae show an increased mineralization. (B) Lateral view of Vertebrae 6–8 (L to R) for WT and fbln1−/−, respectively. (C) Representative µCT scan of a vertebra in 3 planar views, showing two morphometric measurements: vertebral thickness (µm) and vertebral length (µm). (D) Morphometric analysis of individual precaudal vertebral body numbers 6–8 (n = 4 fish/group) revealed a significantly increased thickness and length of the vertebral body in fbln1−/− compared to WT controls. (E) Line plots generated using FishCuT software version 1.2 show significantly increased centra volume (Cent.Vol) and surface area (Cent.SA) in fbln1−/− compared to WT controls (n = 7 fish/group). Similarly, both vertebral (Vert.TMD) and centra TMD (Cent.TMD) are significantly increased in fbln1−/−. Significance: * p < 0.05, ** p < 0.01, and *** p < 0.001, n.s. = non-significant.
|
